Microfluidic devices are becoming increasingly important in various fields of pharmacy, flow chemistry and healthcare. In the embedded microchannel, the flow rates, the dynamic viscosity of the transported liquids and the fluid dynamic properties play an important role. Various functional auxiliary components of microfluidic devices such as flow restrictors, valves and flow meters need to be characterised with liquids used in several microfluidic applications.
Wink of Knowledge: Alternative Liquid Fuels – Similar but Not Quite the Same? – A Journal
Wink of Knowledge: Alternative Liquid Fuels – Similar but Not Quite the Same? – A Journal
We are reinventing ourselves and launching a journal on alternative fuels. The idea is to present a growing collection of measurement data on fuels and to investigate their identification using our key parameters—density, viscosity, and speed of sound. Collaborations, partners, customers, and other interested parties are very welcome to join this initiative.
What is a Wink of Knowledge?
Do you need to quickly measure, draw or do/build something? The speed with which the result may be achieved counts more than the perfect (scientific) approach. For this reason, we have introduced the Wink of Knowledge. Science in the wink of an eye, so to speak. We don’t want to prove anything scientifically. We simply want to quickly demonstrate something pragmatically. If you are interested, we would be happy to discuss these results in more detail with you and your project.
Why this Test?
Alternative fuels such as HVO, biodiesel, or SAF are often considered “drop-in” solutions—meaning they can directly replace conventional diesel or kerosene. Chemically and from a regulatory perspective, this is true to a certain extent. However, there is still a need for monitoring fuels to ensure quality, for example, or to control combustion processes efficiently.
Our hypothesis is: Alternative fuels do not behave like fossil fuels – they often only look like them…And the combination of our measurement parameters reveals these differences.
In our investigations, different liquid fuels have been—and will continue to be—systematically measured and compared. The goal is to make differences visible and thereby improve real processes and/or enable clear identification of fuel types.
Focus of the investigation
Three physical parameters are at the core:
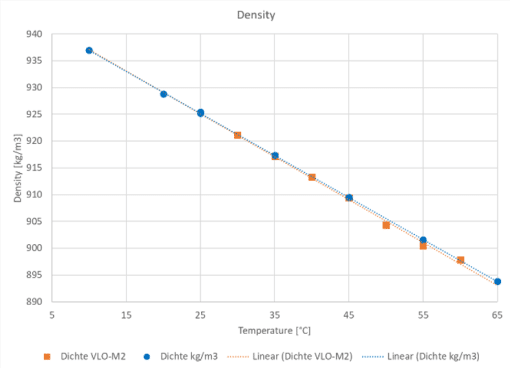
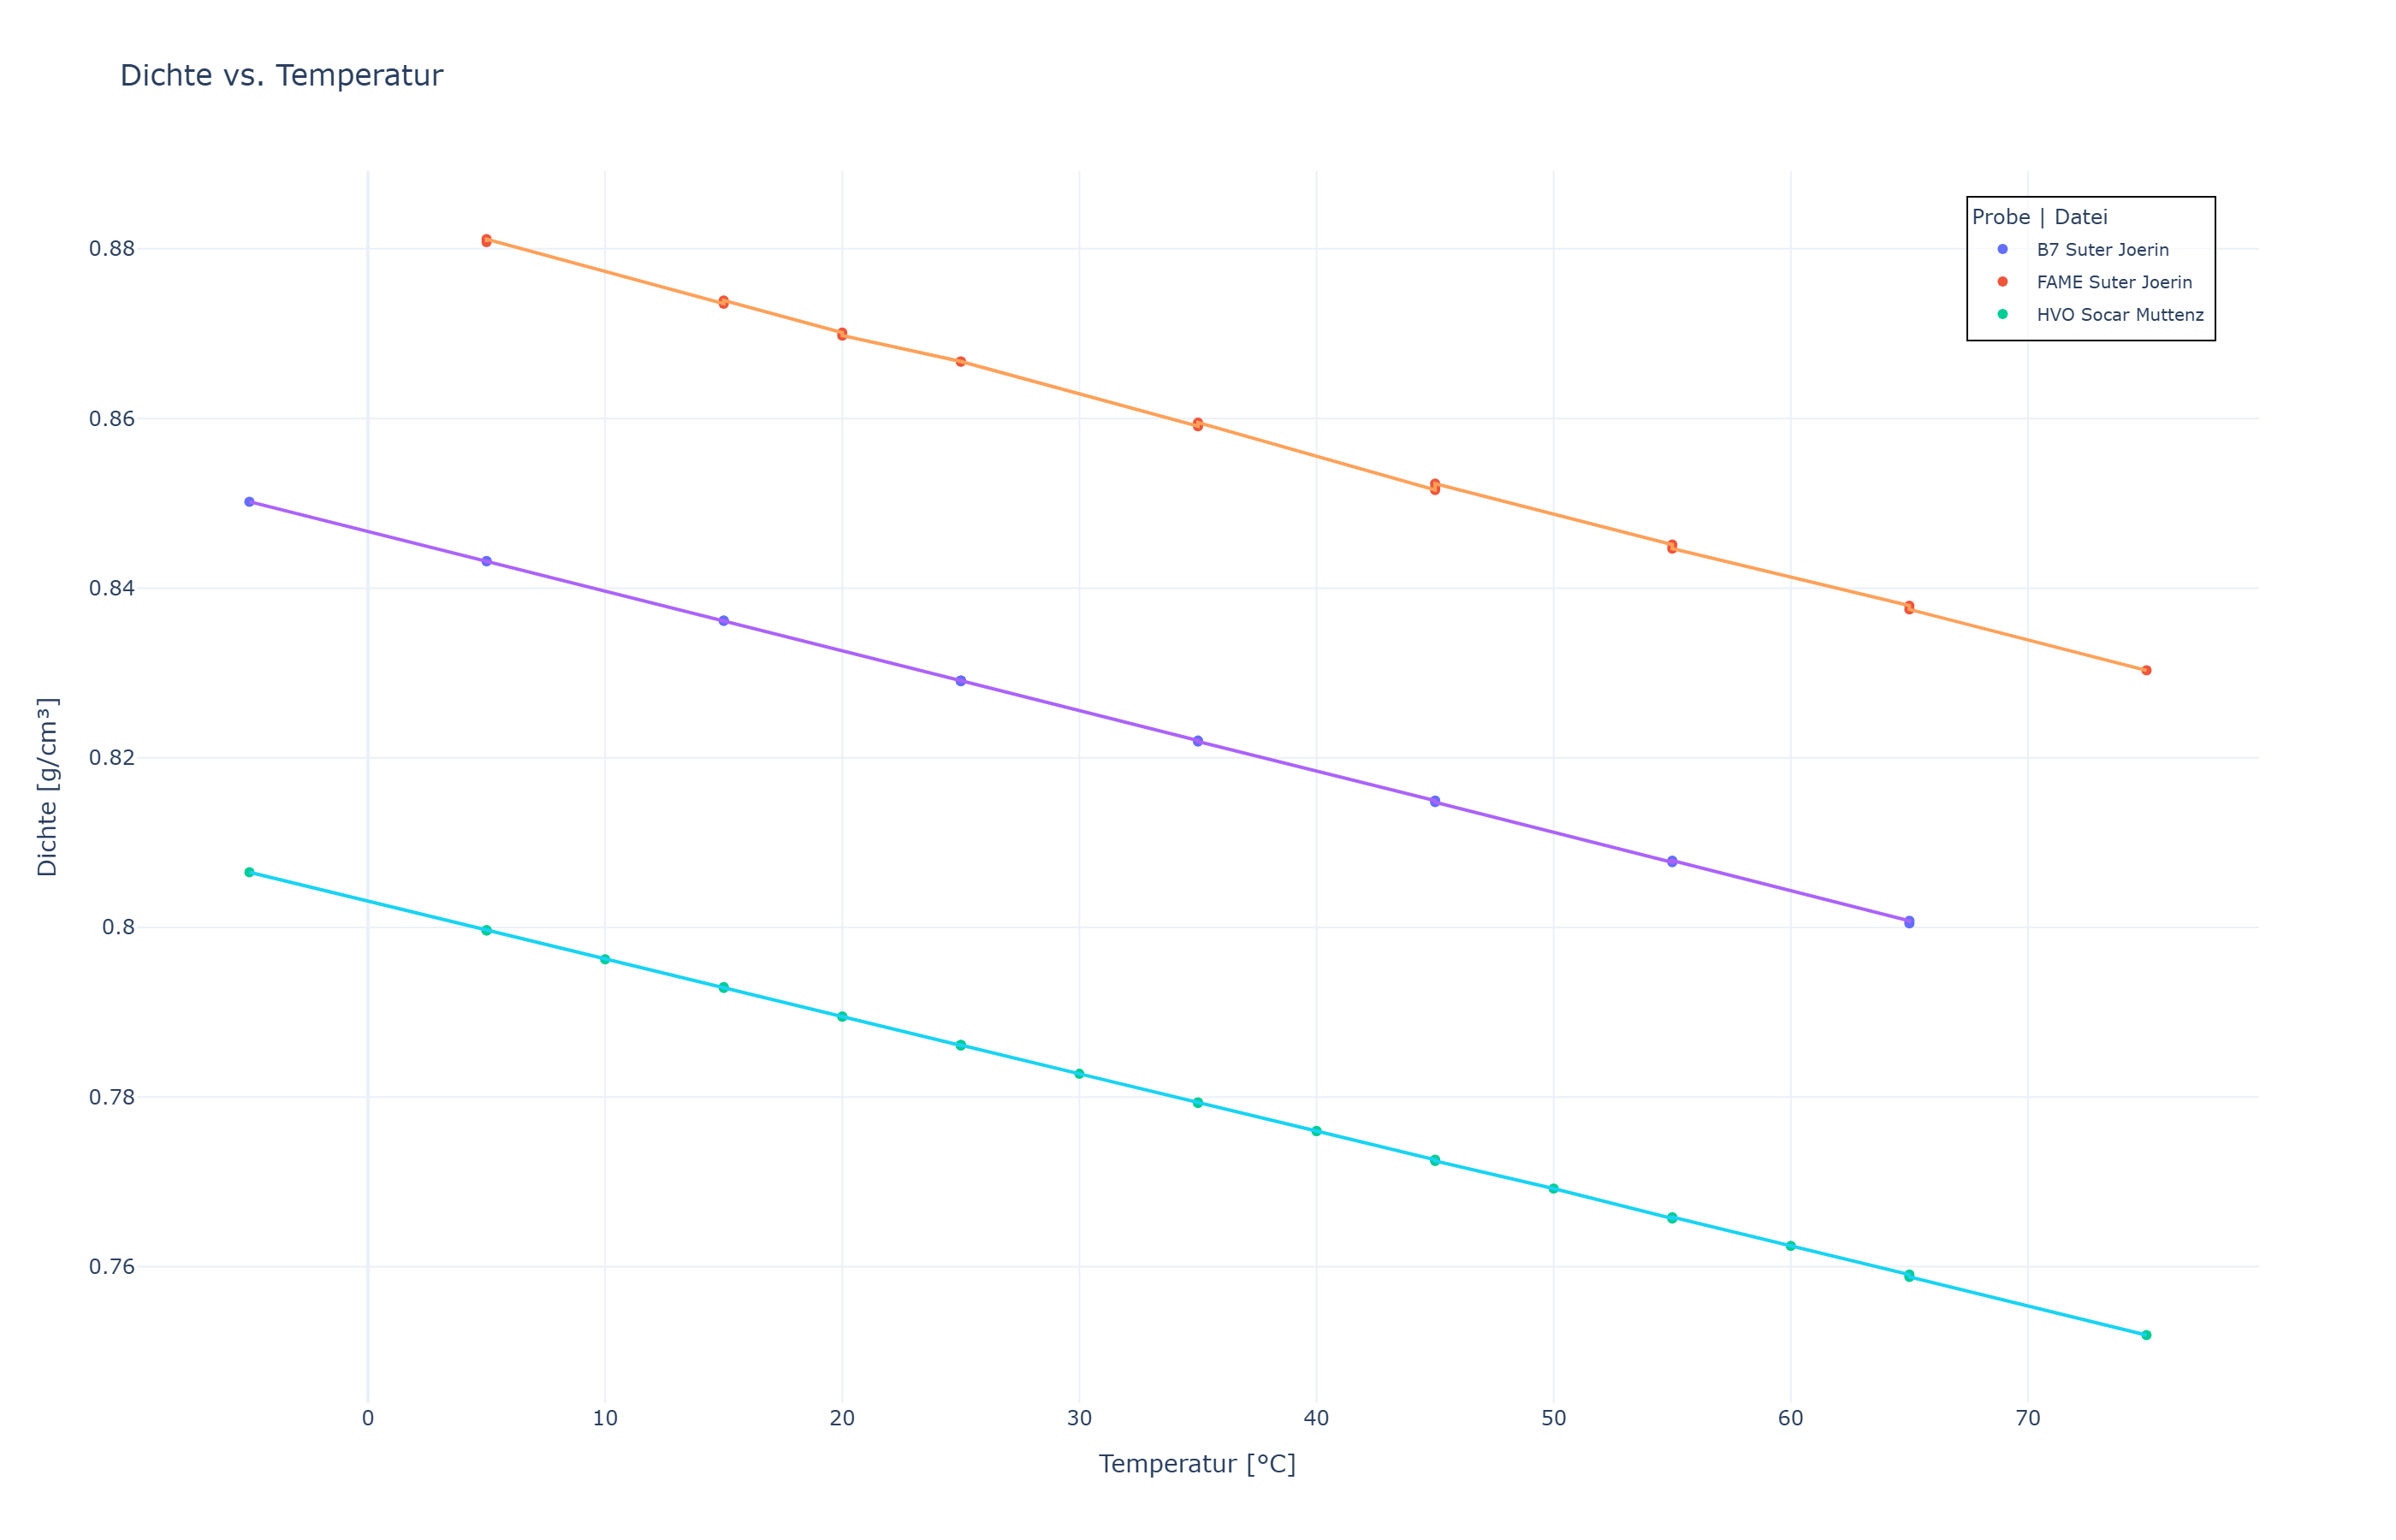
- Density as a robust base parameter for identification, quality assurance, and volume-to-mass conversion
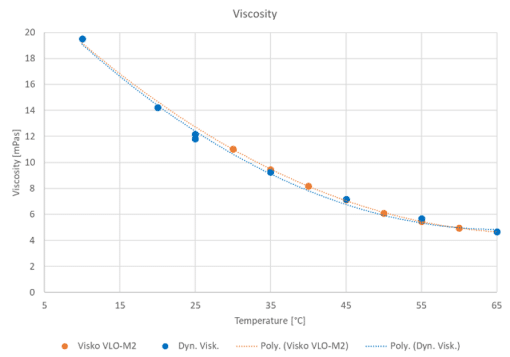
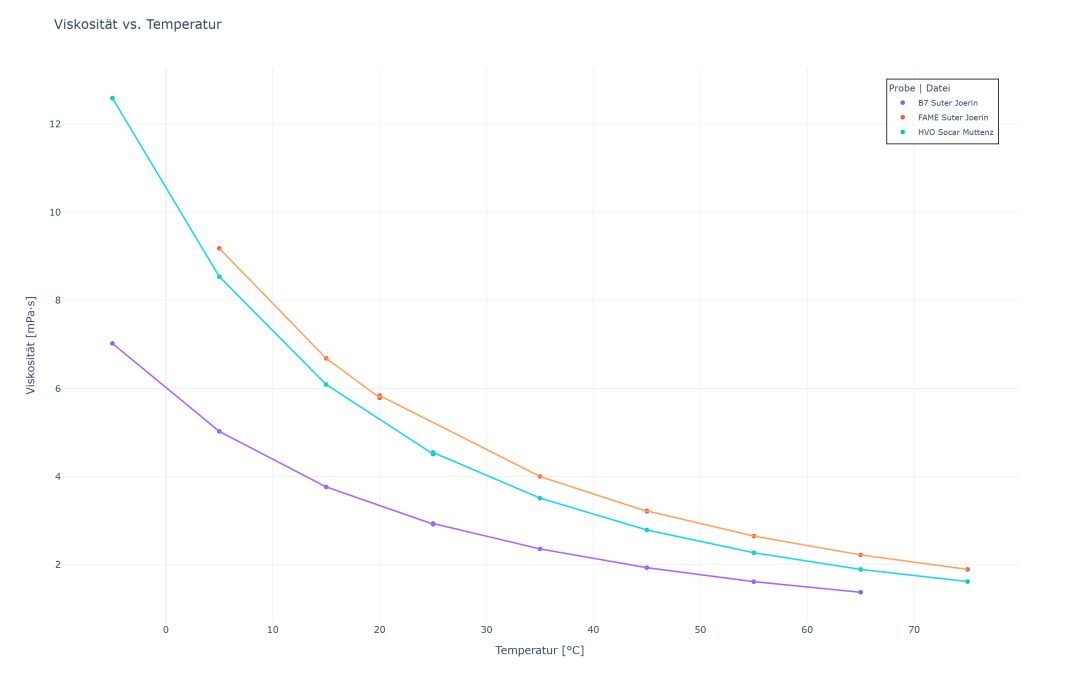
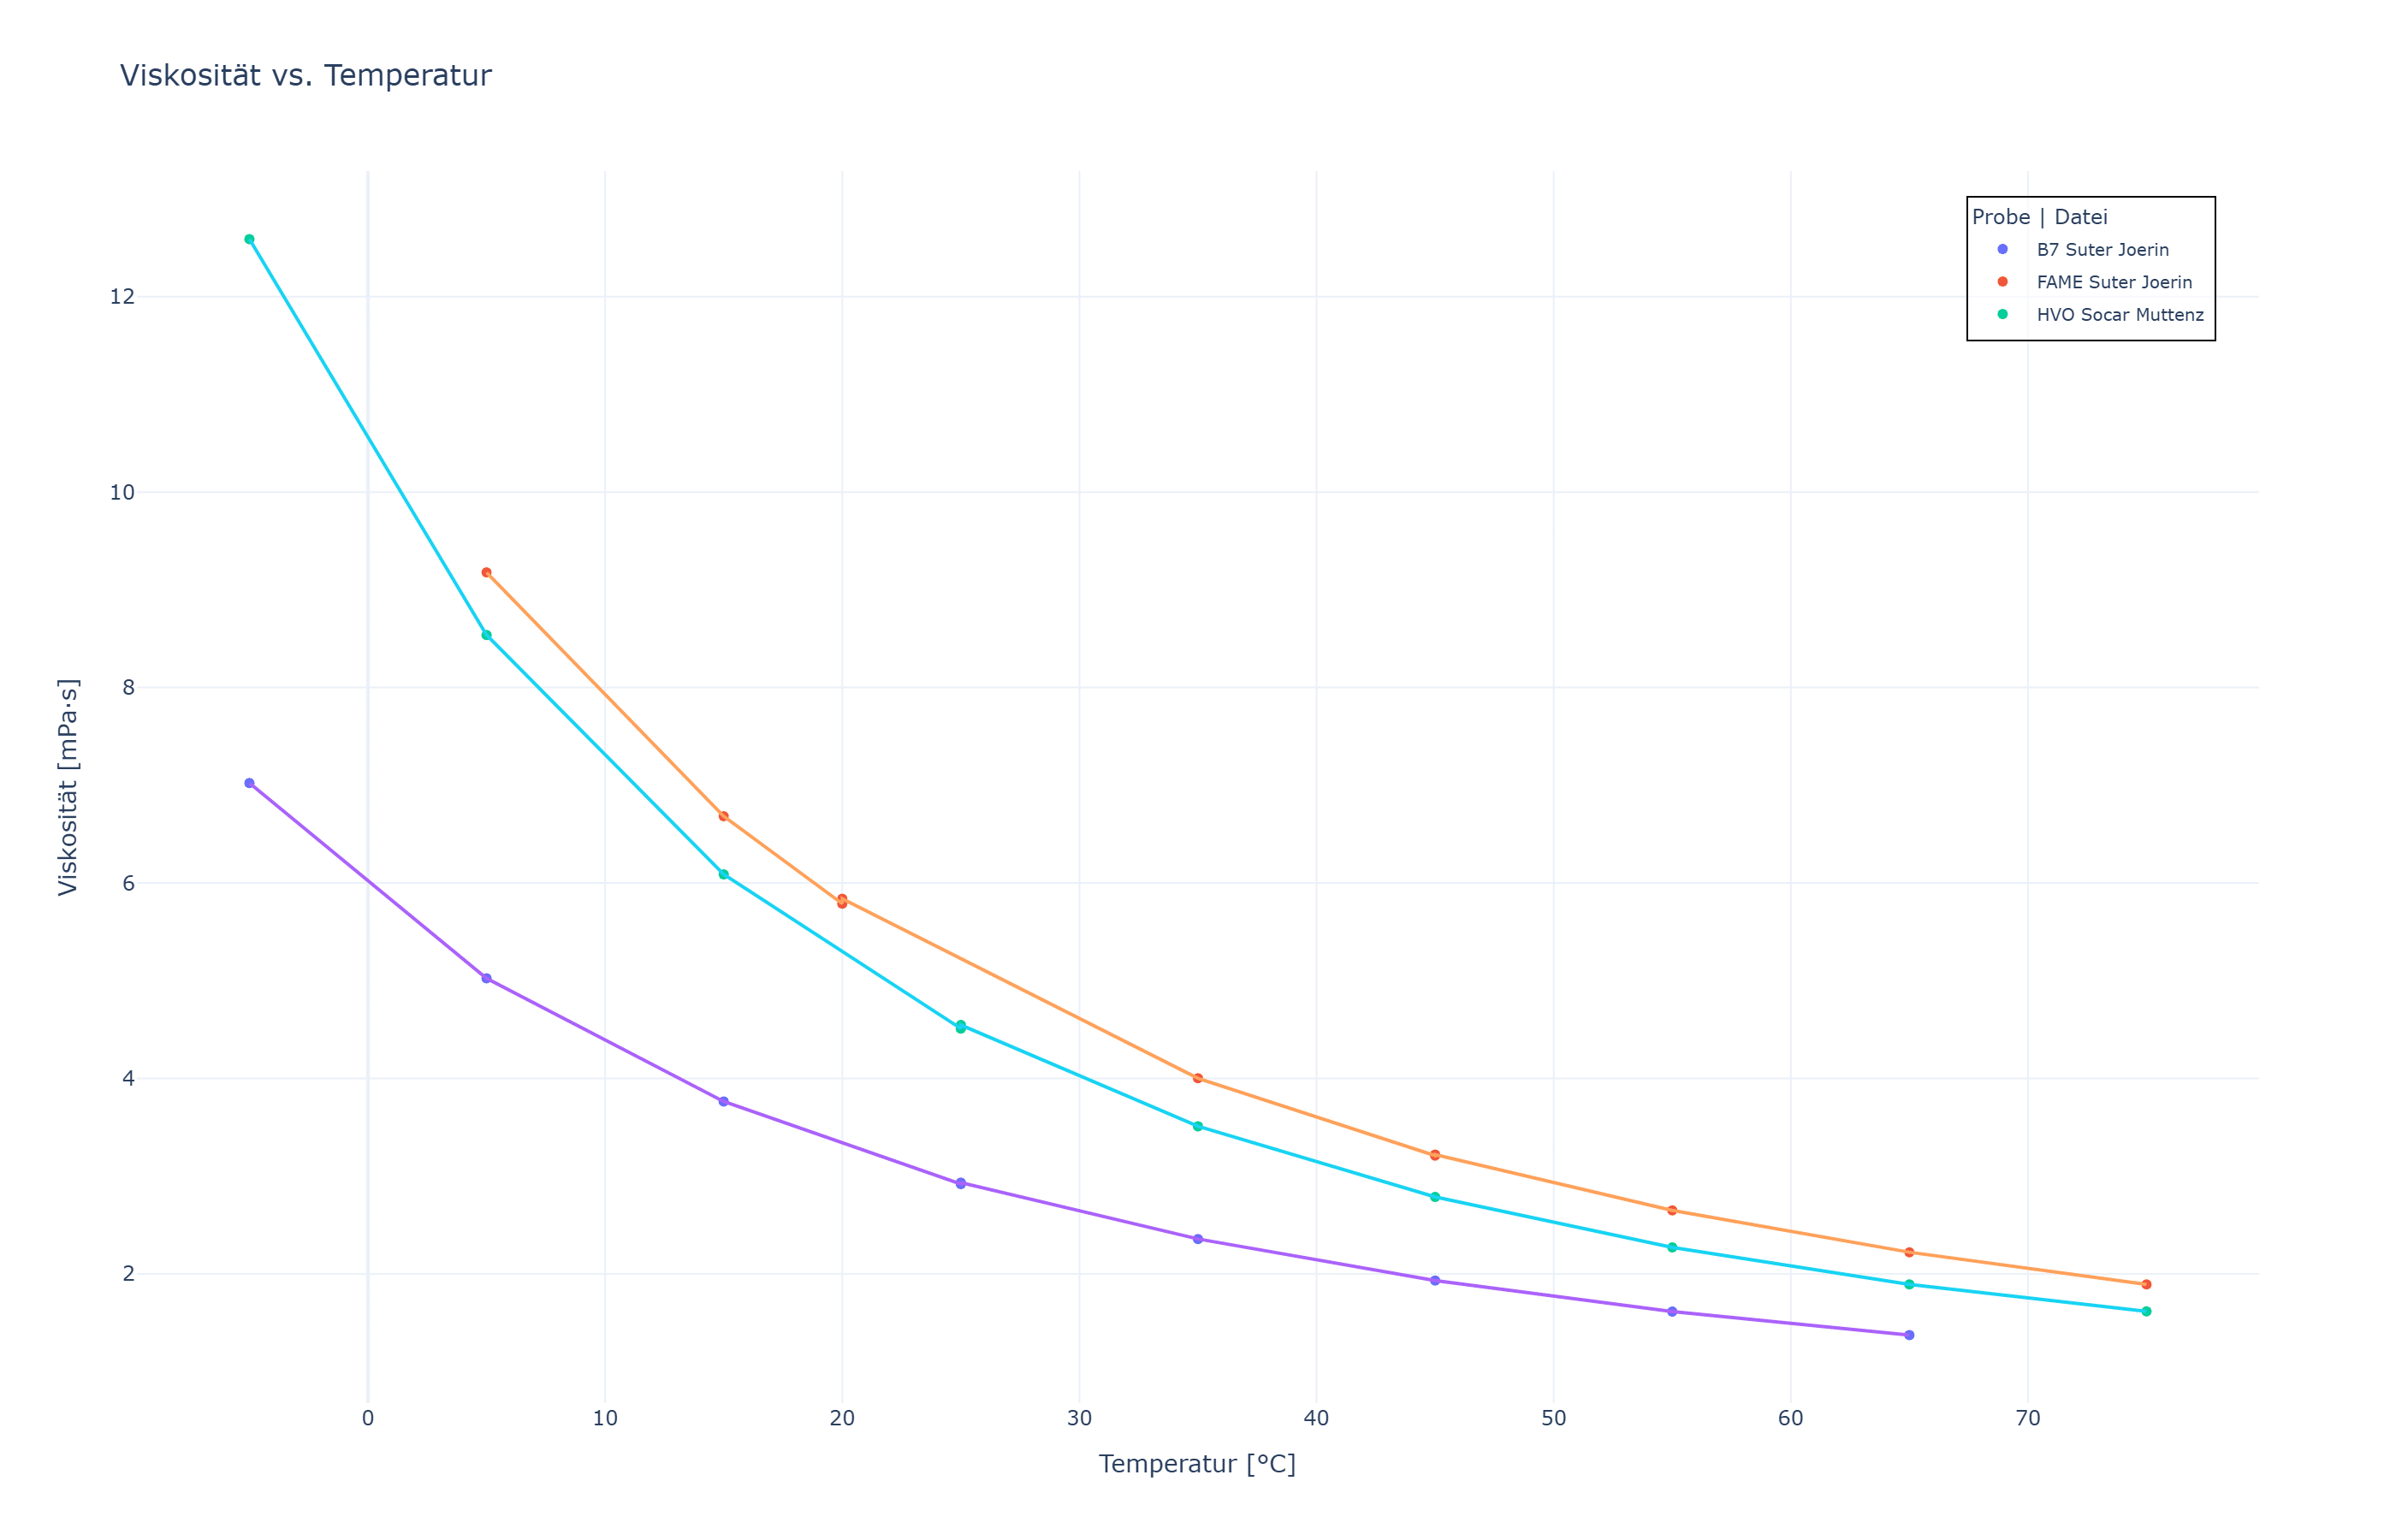
- Viscosity as a process-relevant parameter, e.g. for flow behavior, lubrication, and atomization, as well as compliance with regulatory limits for kerosene, measured at -20°C
- Speed of sound as a parameter that is still rarely used in the fuel sector but provides highly valuable insights
And most importantly:The combination of these parameters.
Only through their correlation does a significantly more complete picture of the medium emerge.
We will continue to test our hypothesis with new fuels and expand this journal continuously – as a growing data collection of real fluid properties.
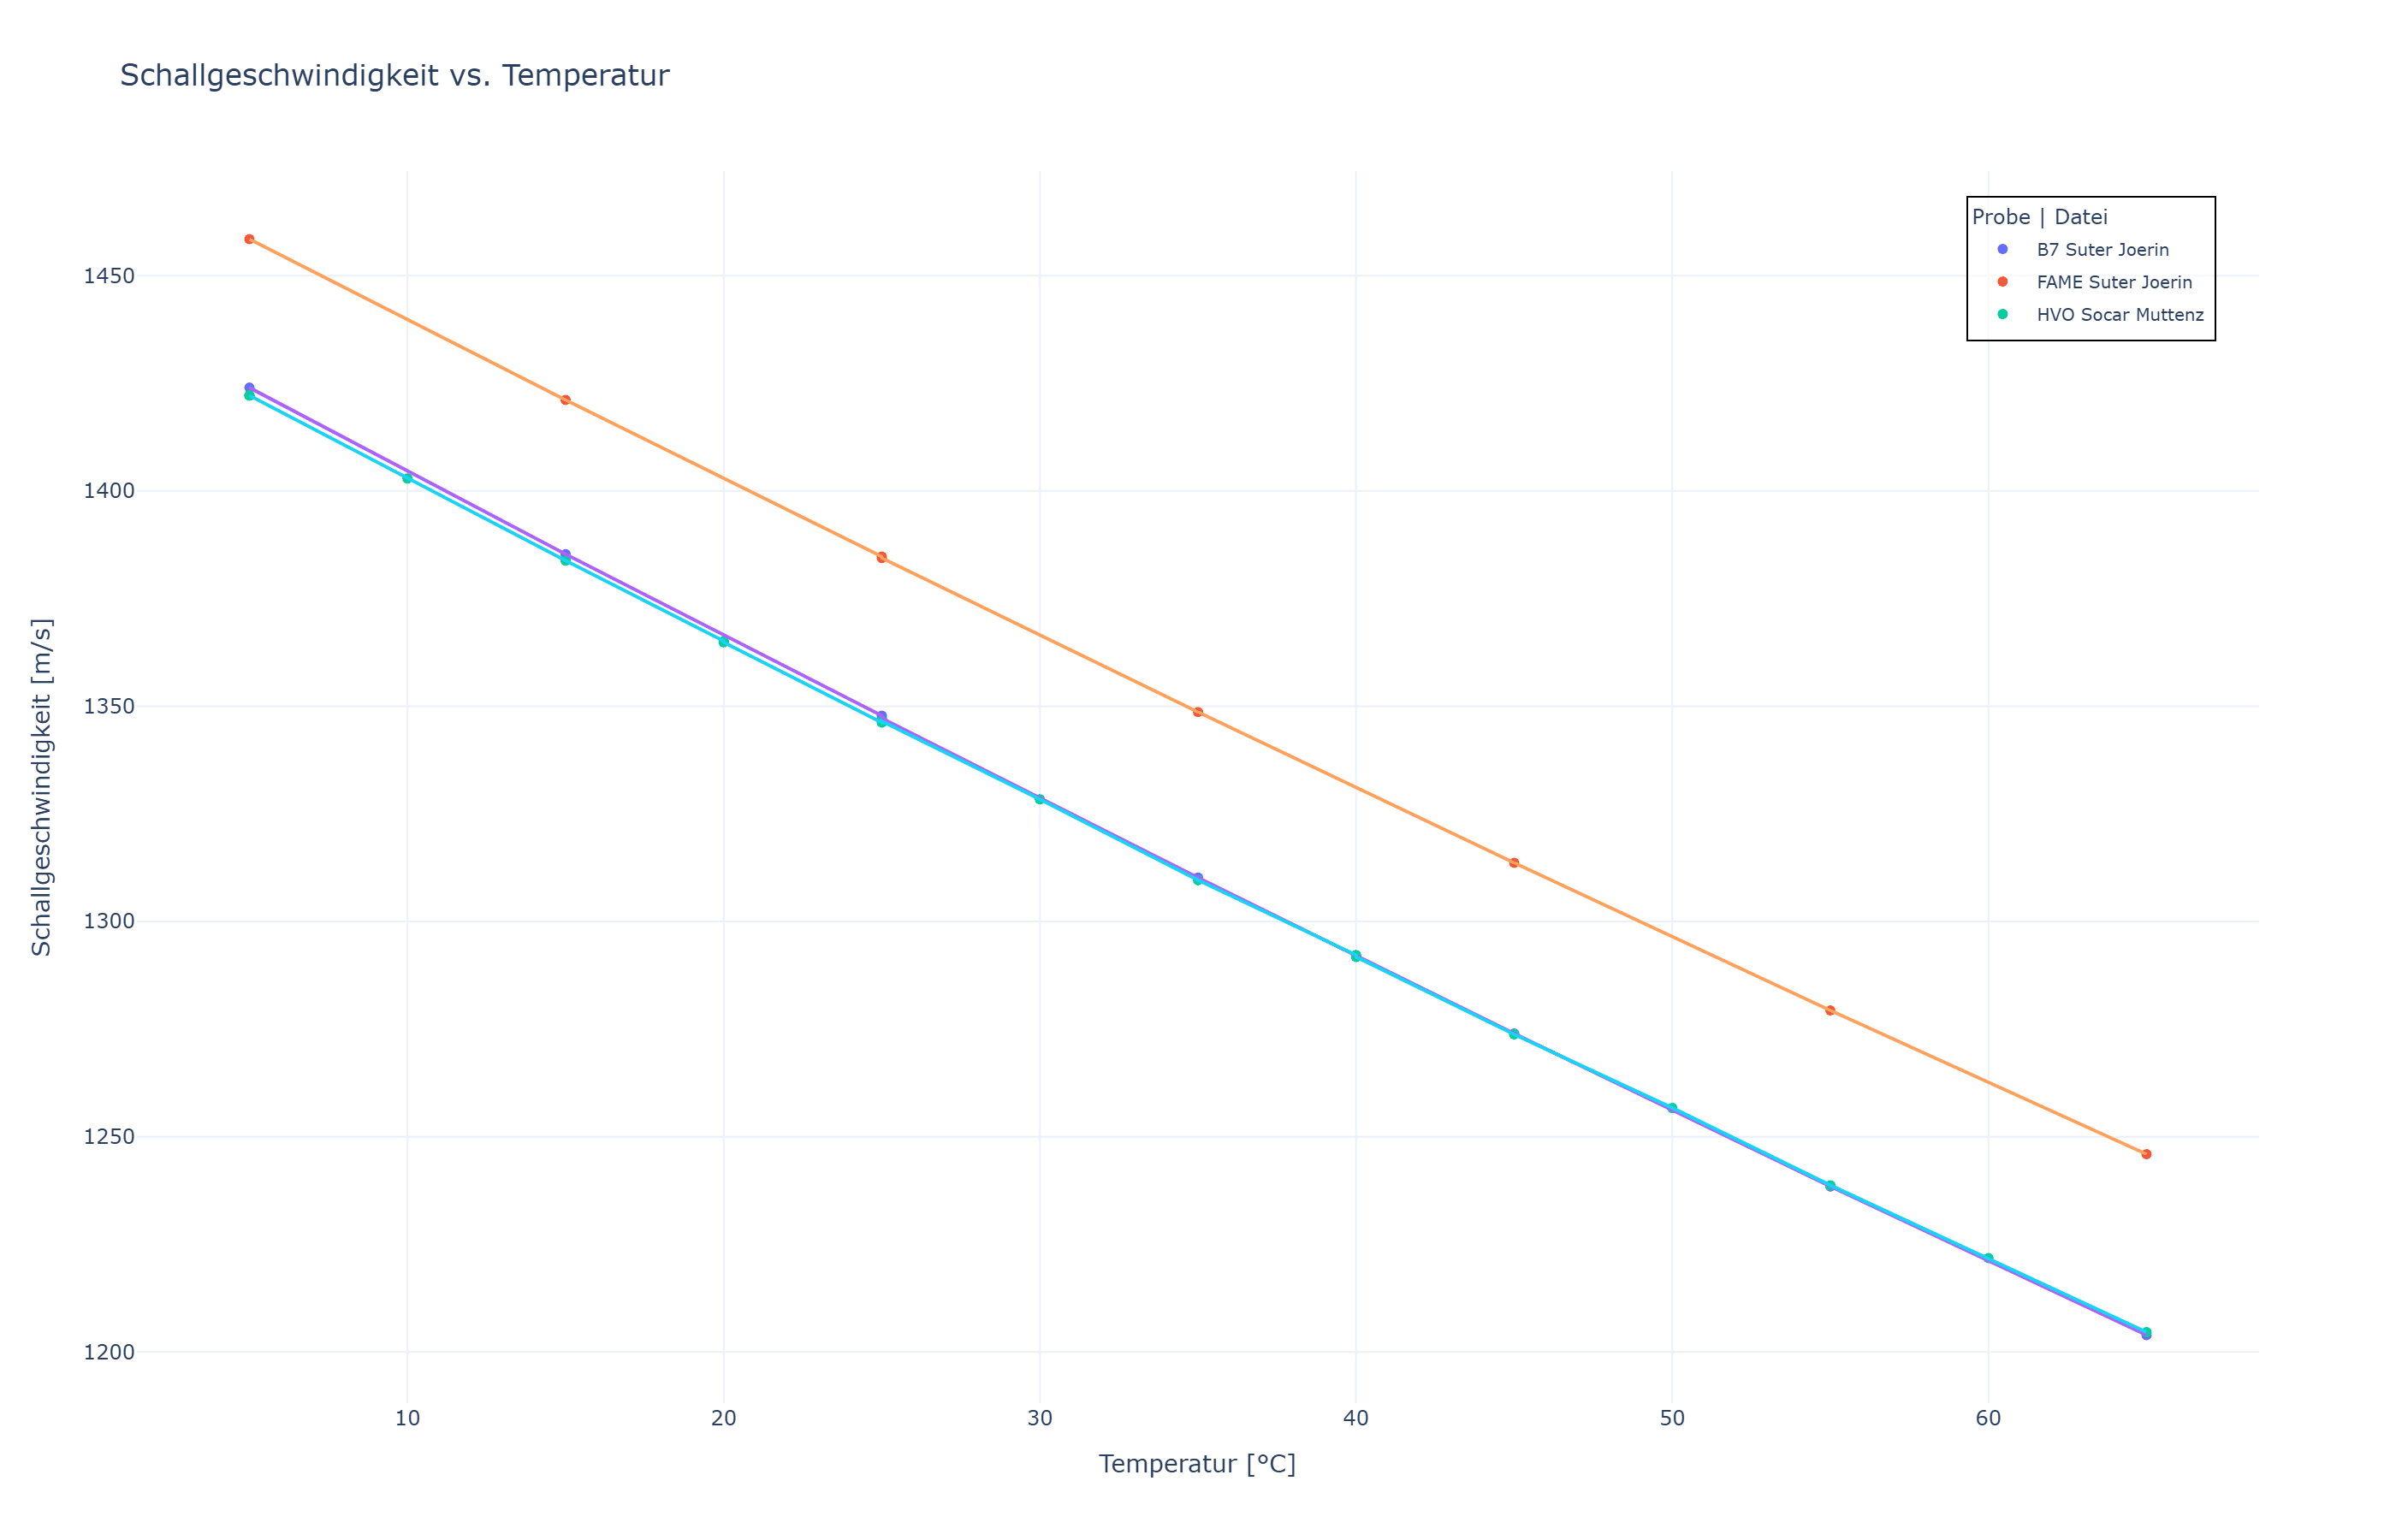
Results
As a first step, three diesel alternatives were analyzed: conventional B7 diesel compared with the widely used alternatives FAME (fatty acid methyl ester, also known as biodiesel) and HVO (Hydrotreated Vegetable Oil). The following plots show clear differences across all parameters (except speed of sound for two samples).
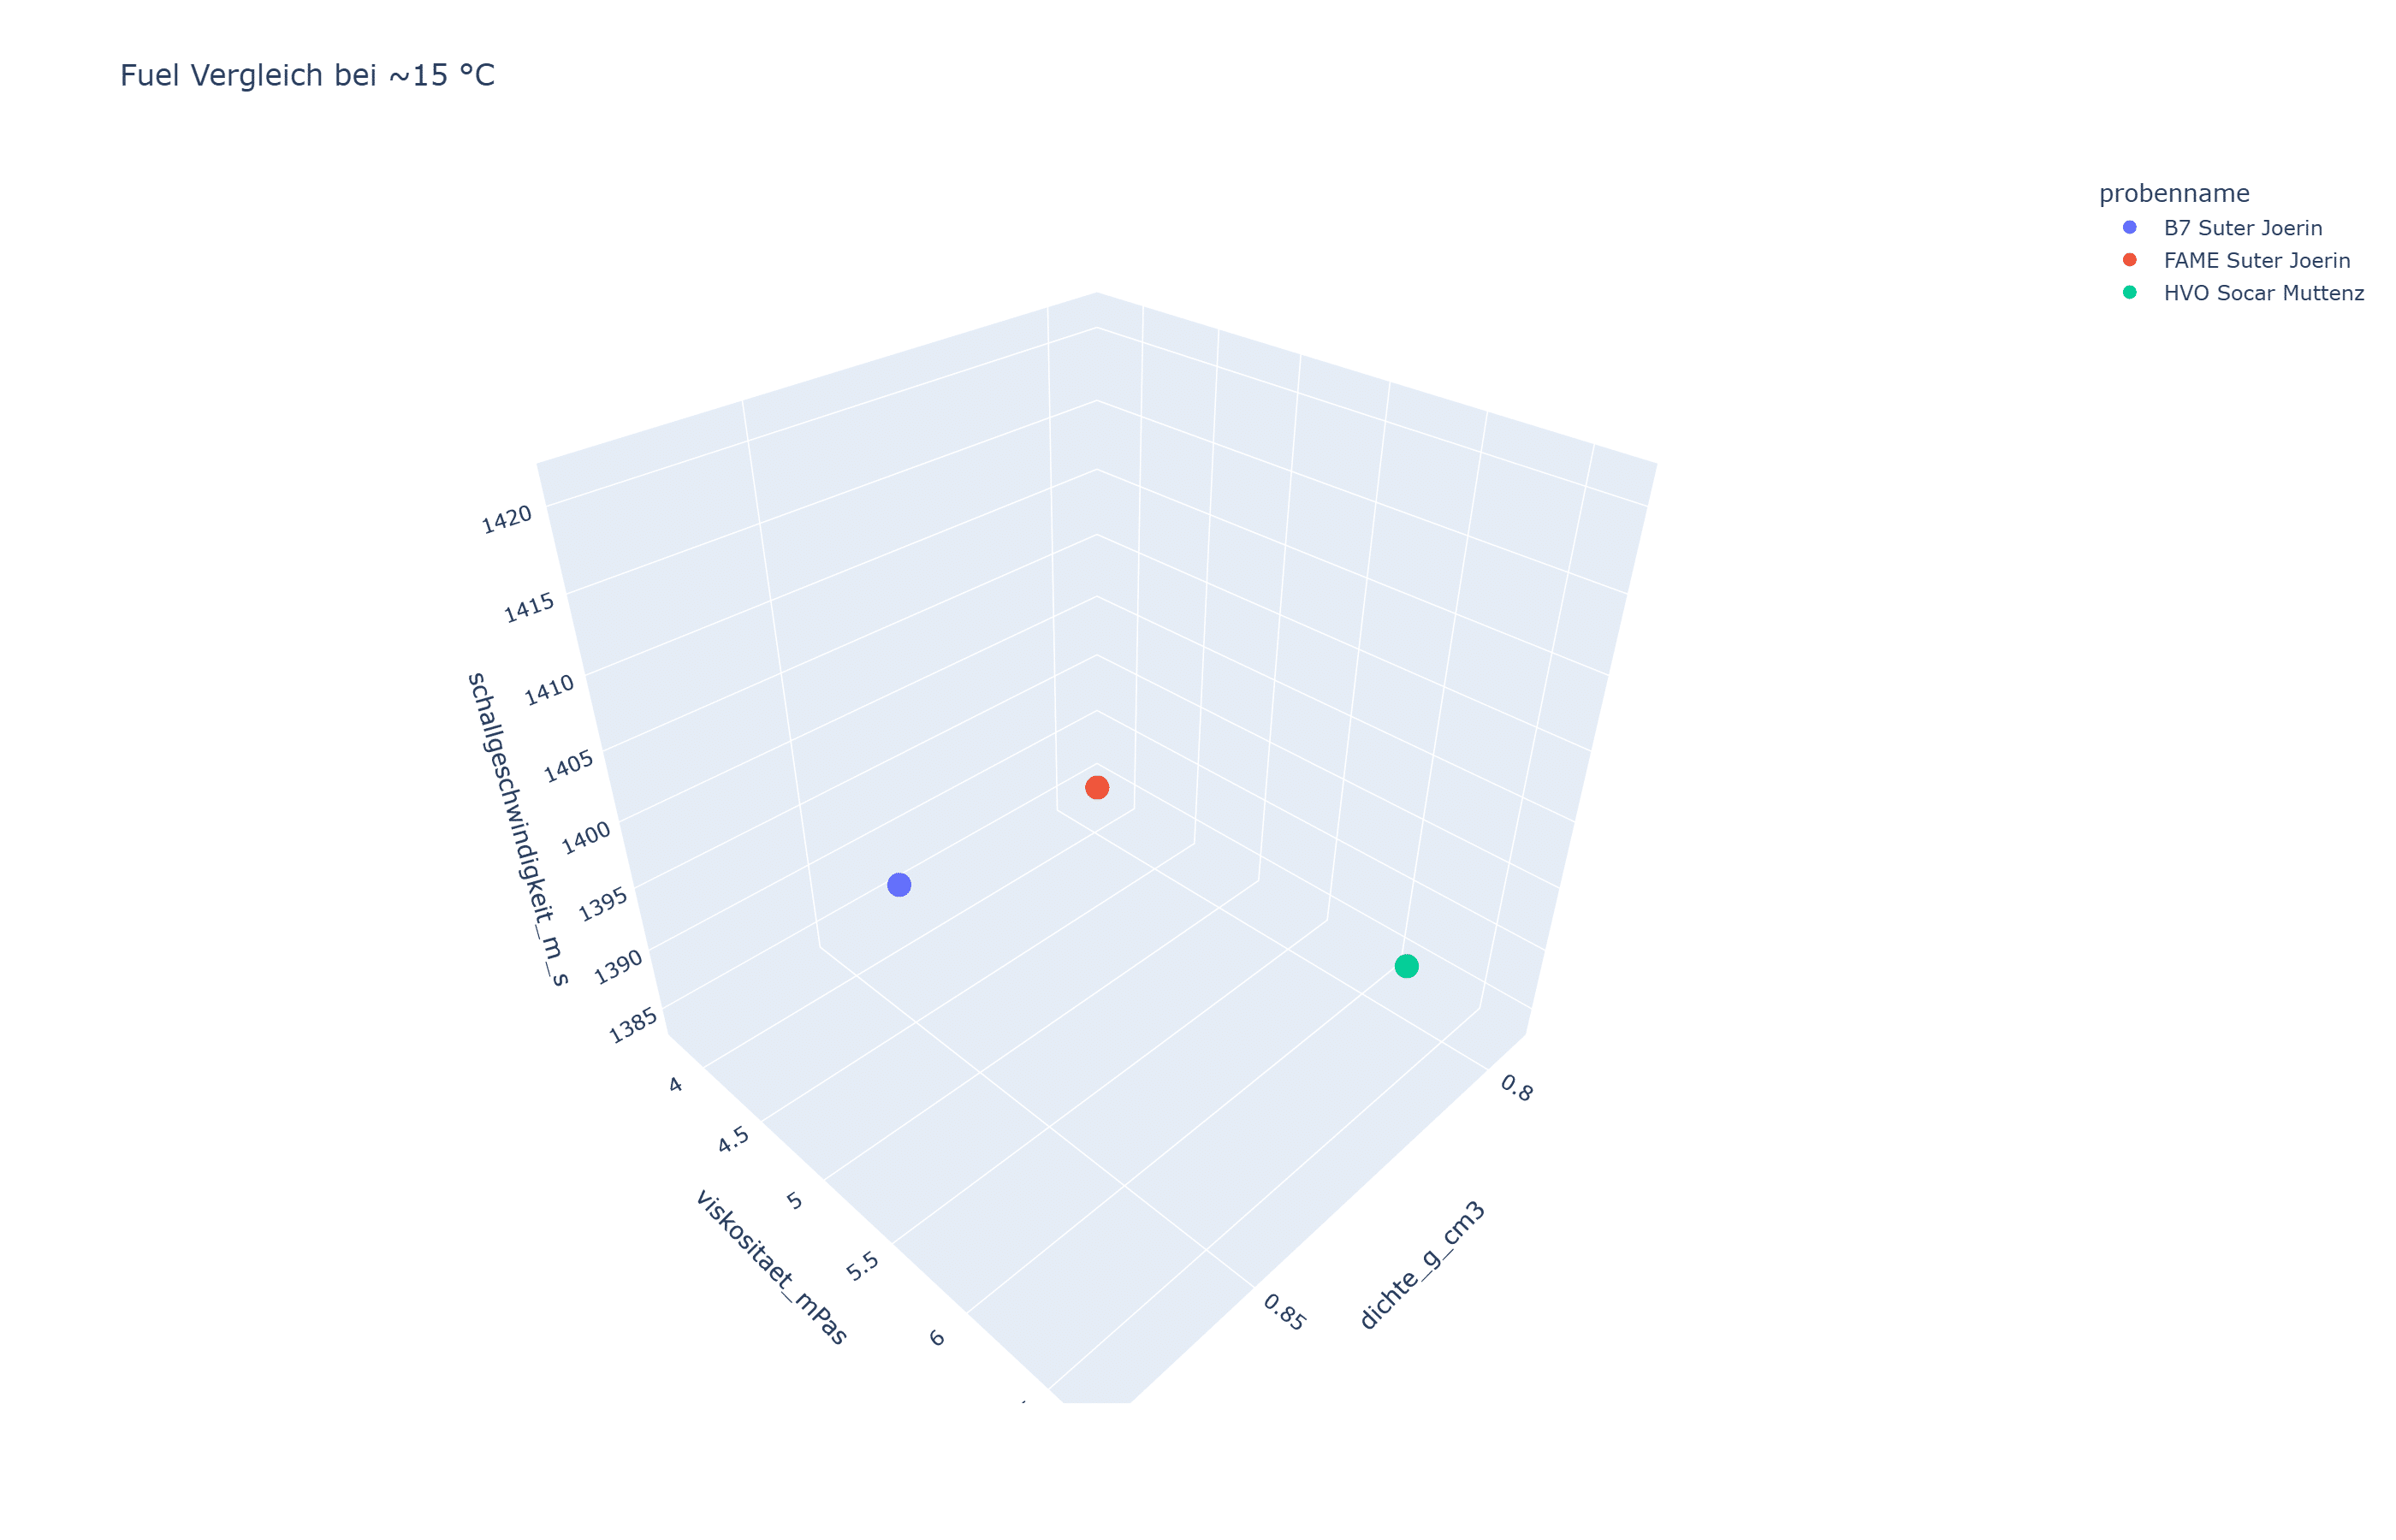
Here is the 3D space defined by our measurement parameters, which we plan to populate with additional measurements in the future:
Stay Tuned!
Sensors that might interest you
Gases
Viscosity
Applications that might interest you

From volume (l)
to mass (kg)
More Winks of Knowledge that might interest you
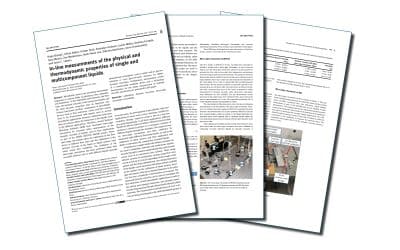
Article: In-line measurements of the physical and thermodynamic properties of single and multicomponent liquids
read more

Article: Density and Concentration Measurement Applications for Novel MEMS-based Micro Densitometer for Gas
Density and Concentration Measurement Applications for Novel MEMS-based Micro Densitometer for GasC. Huber, TrueDyne Sensors AG, Reinach BL (Switzerland), Endress+Hauser Flowtec, Reinach BL (Switzerland)Abstract A MEMS cantilever based resonant device for gas...

Article: Design, Simulation, Fabrication and Characterization of piezoelectric MEMS Cantilever for Gas Density and Viscosity Sensors Applications
Design, Simulation, Fabrication and Characterization of piezoelectric MEMS Cantilever for Gas Density and Viscosity Sensors ApplicationsA. Mehdaoui¹, C. Huber¹, J. Becker¹, F. Schraner¹, L. Villanueva² ¹TrueDyne Sensors AG, Reinach BL (Switzerland), ²Ecole...

Article: Multiparameter Gas-Monitoring System
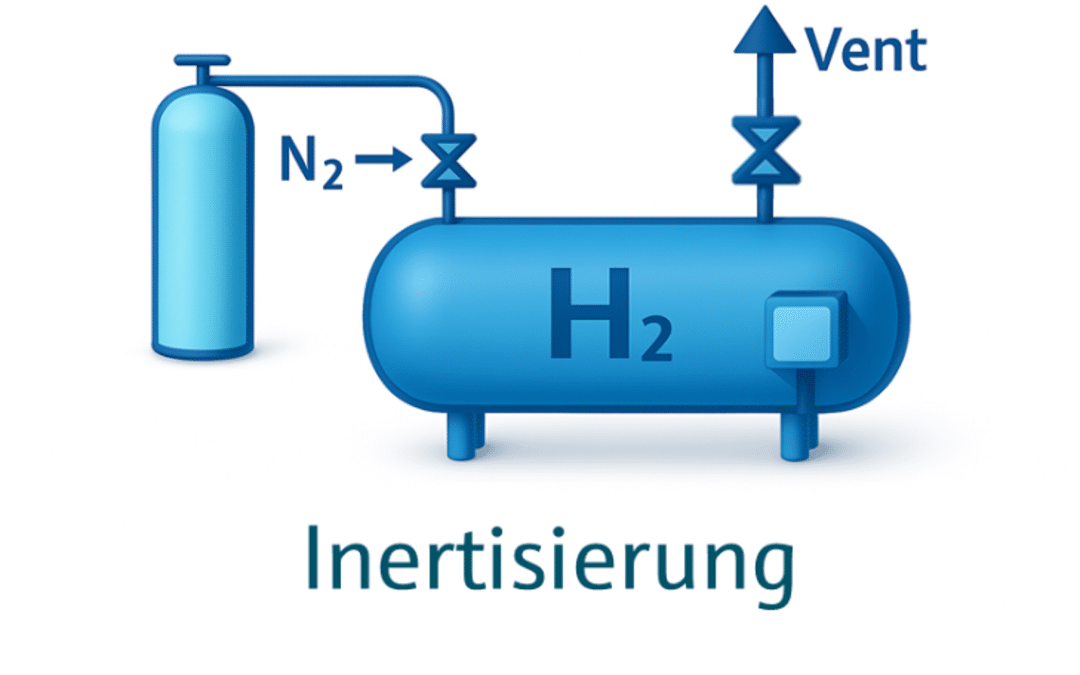
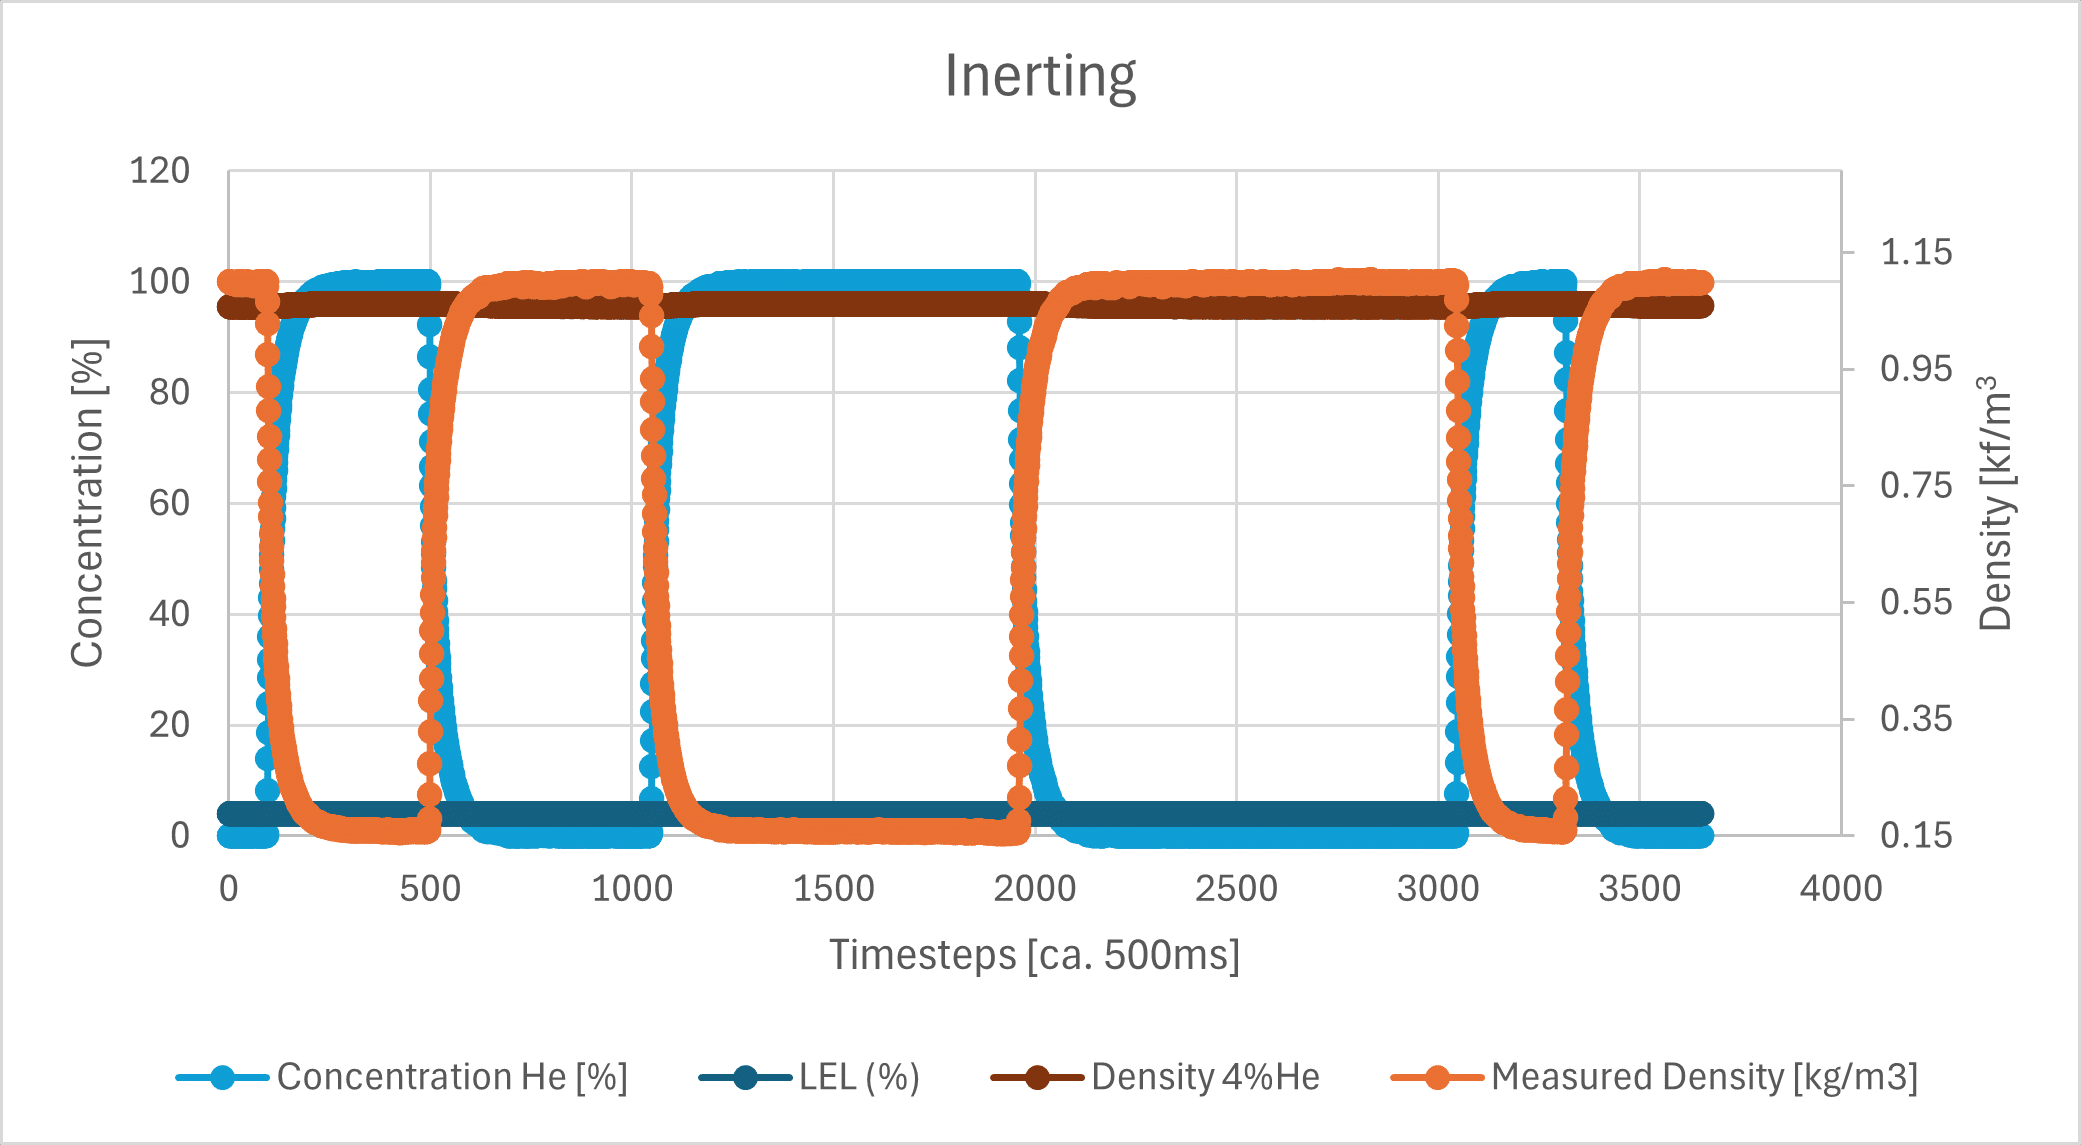
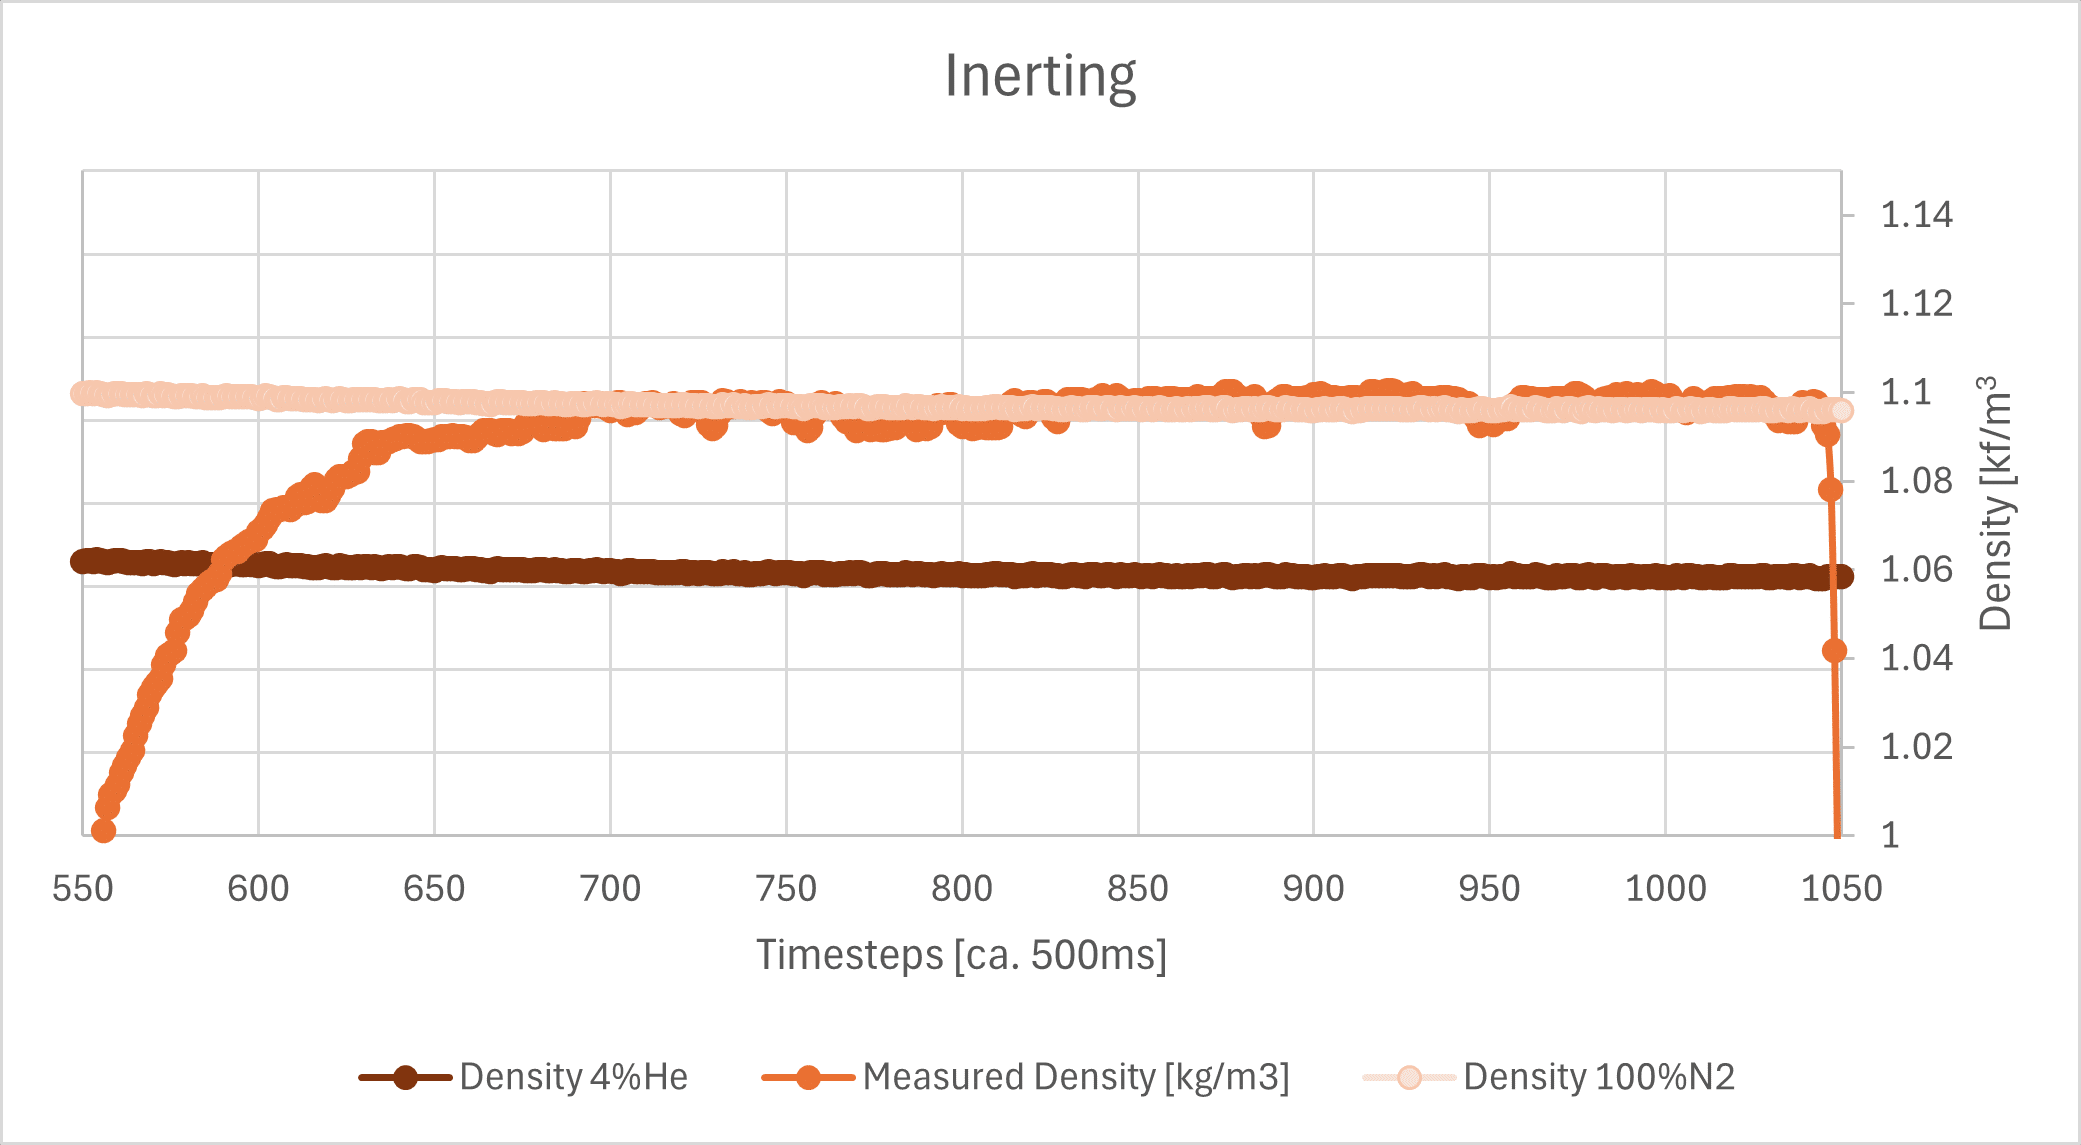
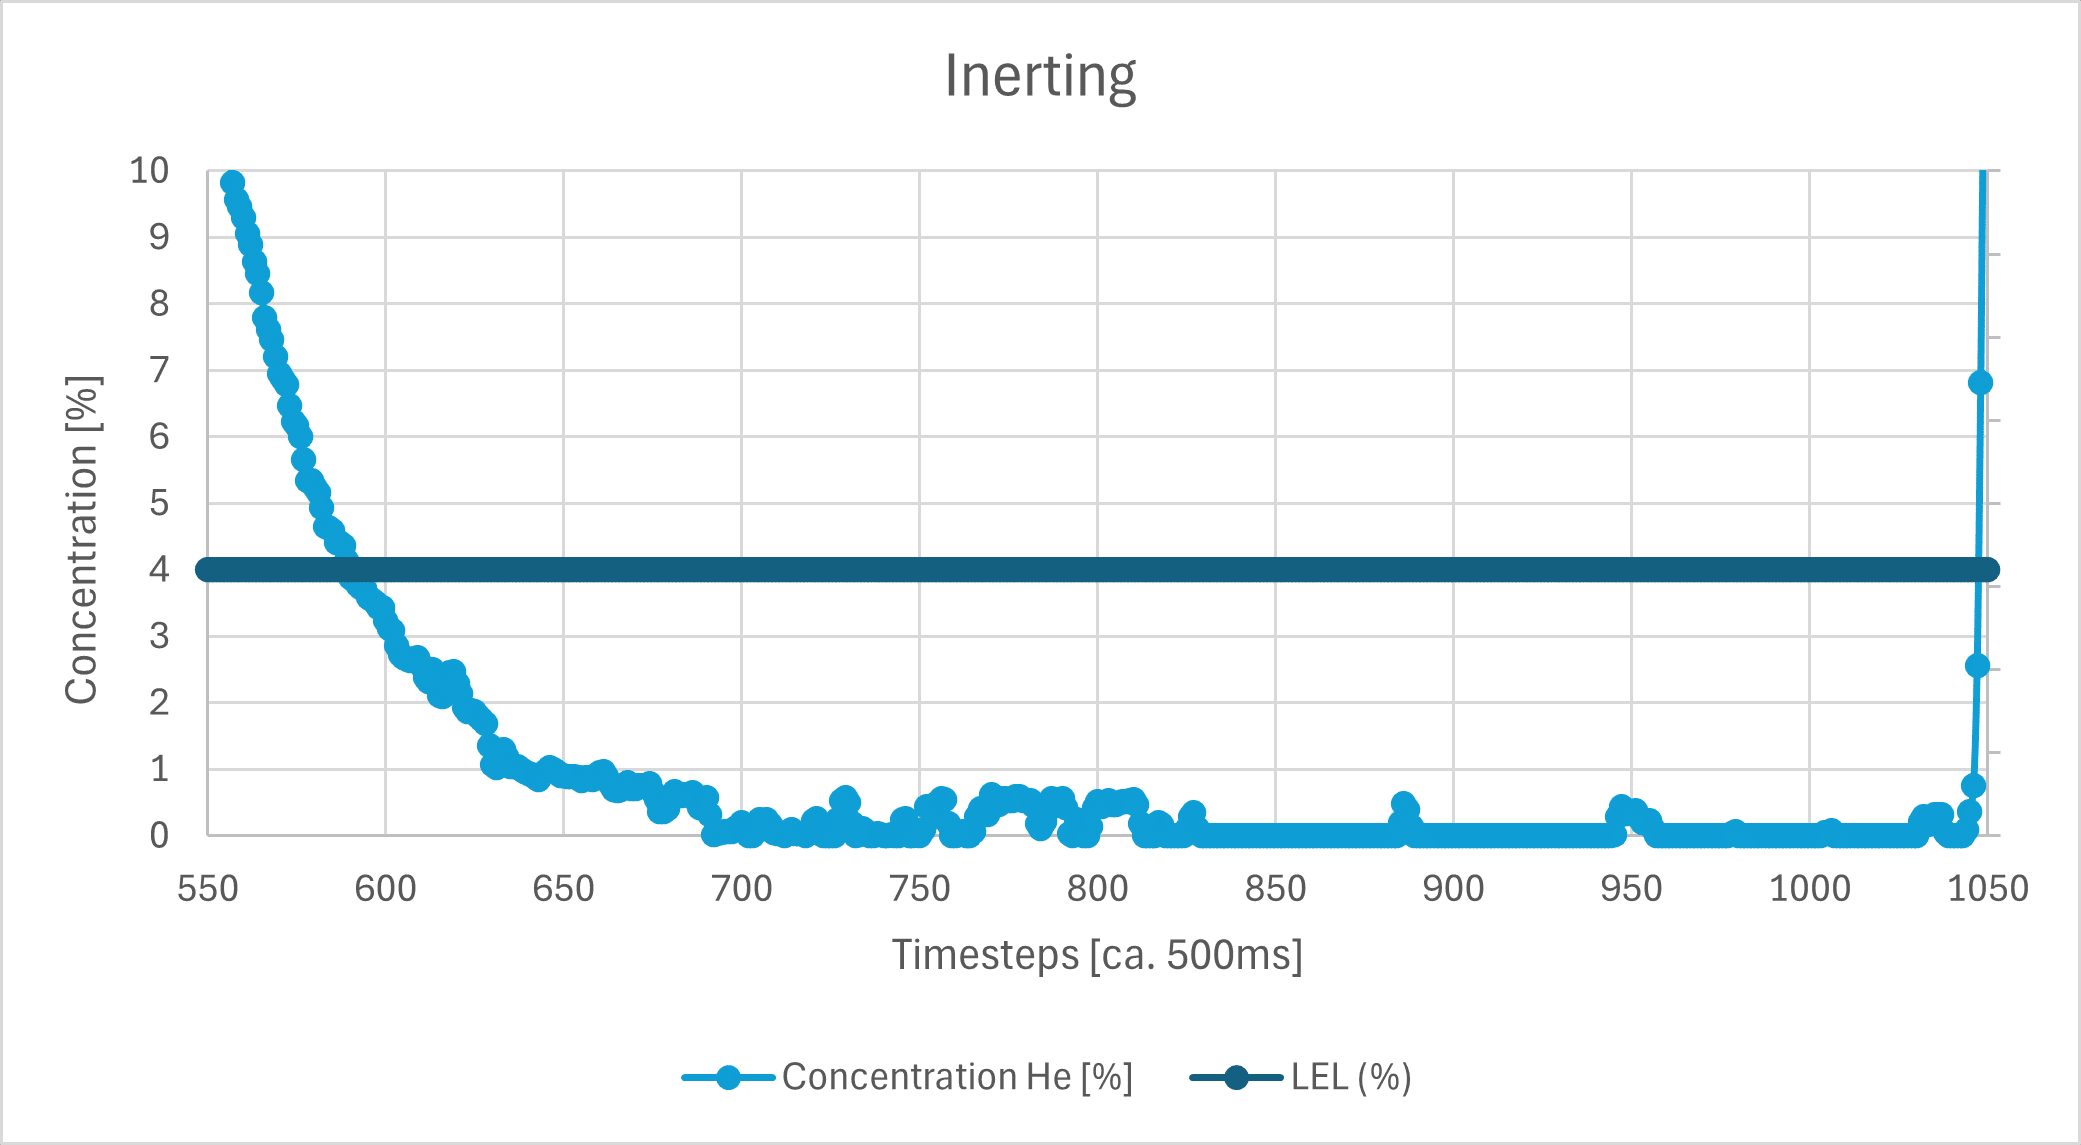
The aim of the study is to develop a compact, robust and maintenance free gas concentration and humidity monitoring system for industrial use in the field of inert process gases. Our multiparameter gas-monitoring system prototype allows the simultaneous measurement of the fluid physical properties (density, viscosity) and water vapor content (at ppm level) under varying process conditions.

Part 3 – MEMS technology
MEMS technologyAt a glance In the previous section (part 2) we got to know the vibration measuring method. This section deals with the establishment of MEMS technology at TrueDyne Sensors AG. The technology has brought about the MEMS sensor, the heart of which is an...
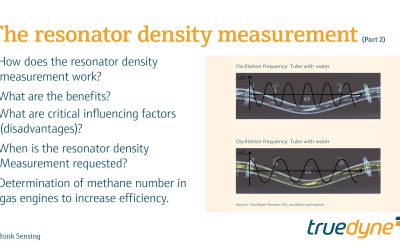
Part 2 – The resonator density measurement
The resonator density measurement At a glance In the previous part (1) we learned about the basics of density measurement and the definition of density. This section is dedicated to the vibration method which is also used by density sensors for density measurement....