Wink of Knowledge: Measuring the density and viscosity of ink in industrial processes
Density and viscosity measurements of ink for inkjet printers using the VLO-M2 viscosity sensor show a high degree of consistency with control measurements in laboratory analyzers over a temperature range of 10 to 65 °C.
Why this test?
The measurement parameters density and viscosity are excellent indicators of ink quality and can also be used to optimize process parameters in the actual printing process.
The density value can be used to derive the concentration of color particles. If the ink is too diluted, this can lead to color deviations in the print, as individual dyes are too low in concentration. It is also important that the ink has a consistent density throughout the entire printing process, as otherwise this can lead to uneven printing results.
Viscosity, on the other hand, has a direct influence on several critical aspects: the flow behavior in the nozzles and nozzle openings, the formation of drops after exiting the nozzle, the drying time of the finished print, the adhesion to the printing medium, and the quality of fine details and resolutions.
Overall, the density and viscosity of inks are crucial for the throughput and quality of industrial printing processes. To achieve consistent, high-quality printing results, these parameters must be carefully monitored and controlled.
What is a Wink of Knowledge?
Do you need to quickly measure, draw or do/build something? The speed with which the result may be achieved counts more than the perfect (scientific) approach. For this reason, we have introduced the Wink of Knowledge. Science in the wink of an eye, so to speak. We don’t want to prove anything scientifically. We simply want to quickly demonstrate something pragmatically. If you are interested, we would be happy to discuss these results in more detail with you and your project.
Results
The density measurement results are shown in Figure 1. The blue circles and the linear trend curve of these measured values show the measurement results of the laboratory analysis. These were determined using the DSA 5000 M laboratory measuring device from Anton Paar. The squares shown in orange and their trend line show the measured values recorded using the VLO-M2 viscosity sensor. A linear change in density can be seen across the entire temperature range.
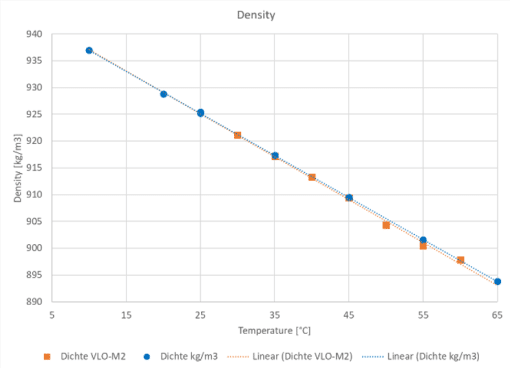
Figure 1: Density from 5 to 65 °C
Congruent with the density measurement, Figure 2 shows the viscosity measurements and their trend line, which is represented by a polynomial instead of a linear dependence.
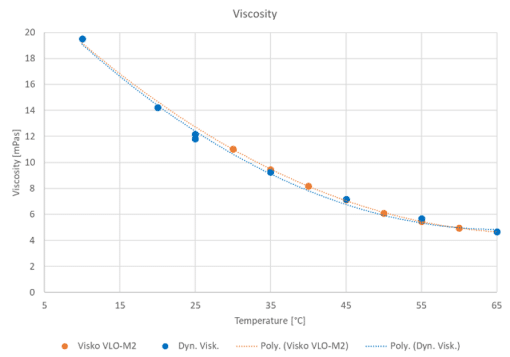
Figure 2: Viscosity from 5 to 65 °C
The viscosity measurement shows that the sensor’s measuring points do not completely match those of the laboratory measuring device. With a measurement deviation of -0.185 mPas, just under ±2%, in viscosity, these results are still well within the sensor’s specification, which is ±[0.2 mPa s + 5% of the measured value]. As mentioned at the beginning, viscosity is a fundamental parameter for printing processes, and viscosity is often adjusted by heating the print head. The VLO-M2 allows both the temperature and viscosity of the ink to be measured in real time, enabling perfect control of the printing process.
These deviations can also be explained by a temperature gradient in the sensor that occurs during heating and cooling in the oven. The parts in direct contact with the warmer (or cooler) ambient air assume a different temperature than the parts and components inside the sensor.
Under real process conditions, where the temperature of the medium and the ambient temperature are stable, a homogeneous temperature can be established throughout the sensor. This means that deviations in viscosity measurement of <2% are plausible.
Procedure
The density and viscosity of an ink for use in industrial printing systems were measured using the VLO-M2 and the DSA 5000 M and SVM 3001 laboratory devices (Anton Paar).
To do this, the VLO-M2 viscosity sensor was completely filled with ink and subjected to a temperature ramp using an oven. Measurement values were recorded continuously. Temperature levels in the range of 5 to 65 °C were set at intervals of 5 °C using the laboratory measuring devices.
These measurements were carried out immediately one after the other to minimize changes in physical properties, for example due to aging effects or moisture ingress.
To ensure comparability of the data, the measurement points recorded in the VLO-M2 viscosity sensor were averaged within a temperature range of ±0.2 °C around the respective level of the laboratory measuring device. This allows the changes in density and viscosity to be graphically represented and estimated.
Conclusion
This test shows that both the density and viscosity of the ink provided for test measurements can be determined very accurately. Compared with the results of the laboratory analysis, a maximum measurement error of ±2% in viscosity and ±0.125% in density can be identified across the entire temperature range measured.
It should be noted that the measurement deviation from the reference can be further reduced by optimizing the measurement setup, making measurement errors in the range of ±1% of viscosity realistic.
With the help of these two parameters, any printing processes where high value is placed on quality and reproducibility can be better monitored and continuously improved.
Which sensors were used?

viscosity sensor VLO-M2
- Click here to learn more about our sensor
Sensors that might interest you
Gases
Viscosity
Applications that might interest you


From volume (l)
to mass (kg)


More Winks of Knowledge that might interest you
Article: In-line measurements of the physical and thermodynamic properties of single and multicomponent liquids
Microfluidic devices are becoming increasingly important in various fields of pharmacy, flow chemistry and healthcare. In the embedded microchannel, the flow rates, the dynamic viscosity of the transported liquids and the fluid dynamic properties play an important role. Various functional auxiliary components of microfluidic devices such as flow restrictors, valves and flow meters need to be characterised with liquids used in several microfluidic applications.

Article: Density and Concentration Measurement Applications for Novel MEMS-based Micro Densitometer for Gas
Density and Concentration Measurement Applications for Novel MEMS-based Micro Densitometer for GasC. Huber, TrueDyne Sensors AG, Reinach BL (Switzerland), Endress+Hauser Flowtec, Reinach BL (Switzerland)Abstract A MEMS cantilever based resonant device for gas...

Article: Design, Simulation, Fabrication and Characterization of piezoelectric MEMS Cantilever for Gas Density and Viscosity Sensors Applications
Design, Simulation, Fabrication and Characterization of piezoelectric MEMS Cantilever for Gas Density and Viscosity Sensors ApplicationsA. Mehdaoui¹, C. Huber¹, J. Becker¹, F. Schraner¹, L. Villanueva² ¹TrueDyne Sensors AG, Reinach BL (Switzerland), ²Ecole...

Article: Multiparameter Gas-Monitoring System
The aim of the study is to develop a compact, robust and maintenance free gas concentration and humidity monitoring system for industrial use in the field of inert process gases. Our multiparameter gas-monitoring system prototype allows the simultaneous measurement of the fluid physical properties (density, viscosity) and water vapor content (at ppm level) under varying process conditions.

Part 3 – MEMS technology
MEMS technologyAt a glance In the previous section (part 2) we got to know the vibration measuring method. This section deals with the establishment of MEMS technology at TrueDyne Sensors AG. The technology has brought about the MEMS sensor, the heart of which is an...
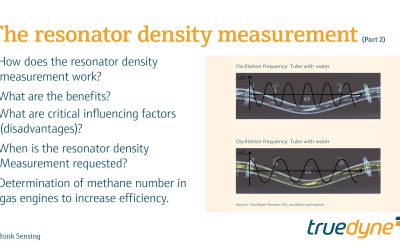
Part 2 – The resonator density measurement
The resonator density measurementAt a glance In the previous part (1) we learned about the basics of density measurement and the definition of density. This section is dedicated to the vibration method which is also used by density sensors for density measurement....