Wink of Knowledge: Mineral content of water
The mineral content of water plays a key role — both in terms of beverage quality and industrial processes. While it often causes problems such as calcification or corrosion in industry, it promotes health and influences taste in beverages. Whether it’s a bug or a feature, we show how mineral content can be reliably determined using density measurement.
Why this test?
Interest in analyzing drinking water probably goes back to the earliest days of human history. While the central question used to be, “Is the water even drinkable?”, today the focus is increasingly on optimization: “How can I improve water specifically for my individual needs?”
A key and frequently studied property is the mineral content of water, which can be used to determine water hardness, among other things. Minerals such as fluoride, sodium, calcium, and magnesium are essential for numerous bodily functions—for example, for teeth, bones, nerves, and muscles. At the same time, these minerals can also have undesirable effects in everyday life, such as calcification or corrosion in household appliances such as coffee machines or washing machines.
In the beverage industry, the taste-influencing effect of certain ions (e.g., chloride or sodium) also plays a role. In beer brewing, the chemical properties of minerals during the mashing process are also crucial—further information on this can be found at brunwater.com, for example.
Numerous methods are available today for determining mineral content: from simple test strips and electrical measurements of free ions to high-precision laboratory analyses such as mass spectrometry. One method that is less well known but very promising is density measurement, which will be examined in more detail in this article.
Density measurement is already well established in the brewing process and is therefore particularly suitable. It not only allows seasonal fluctuations in the mineralization of the water to be monitored, but also directly provides the starting value for the subsequent extraction and fermentation processes – both of which are also monitored by means of density measurement.
What is a Wink of Knowledge?
Do you need to quickly measure, draw or do/build something? The speed with which the result may be achieved counts more than the perfect (scientific) approach. For this reason, we have introduced the Wink of Knowledge. Science in the wink of an eye, so to speak. We don’t want to prove anything scientifically. We simply want to quickly demonstrate something pragmatically. If you are interested, we would be happy to discuss these results in more detail with you and your project.
Results
Various commercially available mineral waters and tap water from different regions were examined. The measurements were carried out using both our DLO-M2 and the high-precision laboratory device DSA 5000 M from Anton Paar. The reference values included information provided by the manufacturers and publicly available sources such as trinkwasser.ch for Swiss tap water.
The existing concentration model of the DLO-M2 for “Total Dissolved Solids” (TDS) was used to convert the measured density values into mineral content.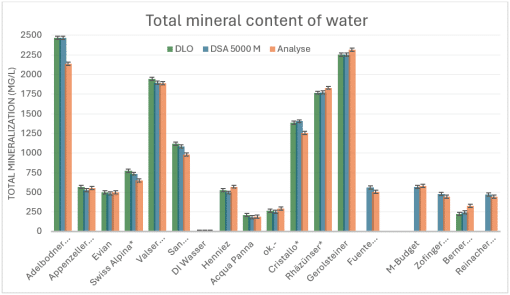
FIgure 1: Mineral content of different types of water. Orange bars represent laboratory analysis, gray and blue bars represent mineral content based on density measurements with the DLO-M2 and DSA 5000 M, respectively.
The results show a very good correlation between the measurements taken by the DLO-M2 and those taken by the laboratory device (gray and blue bars), which underlines the high measurement accuracy of the DLO-M2. However, there are certain deviations compared to the actual mineral content. These can be explained in part by natural fluctuations in tap water. In addition, the physical measurement value—whether density or electrical conductivity—also depends on the chemical composition of the dissolved minerals. Factors such as charge number and molecular mass influence the measurement. Without precise knowledge of the composition, an assumption must therefore be made about a “typical” mineral distribution.
One way to estimate the relationship between the physical measurement and the actual mineral content is to perform a correlation analysis between the measurements and the manufacturer’s specifications: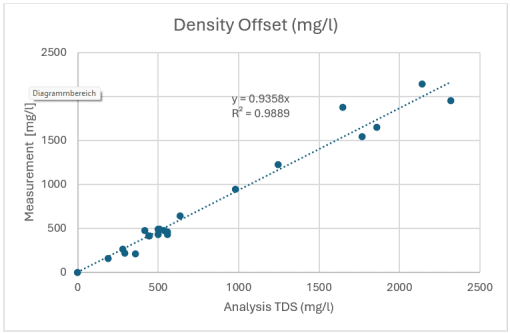
Figure 2: Correlation between density measurement in mg/ml and mineral content according to laboratory analysis, also in mg/l
For the samples examined here, the conversion factor between density [mg/ml] and mineral content [mg/ml] is 0.936. Conversely, this means that an increase in density of 1 mg/l compared to distilled water can be expected to result in a mineral content of approximately 1.07 mg/l. The graph also shows that the correlation works better at low mineral content than at high content.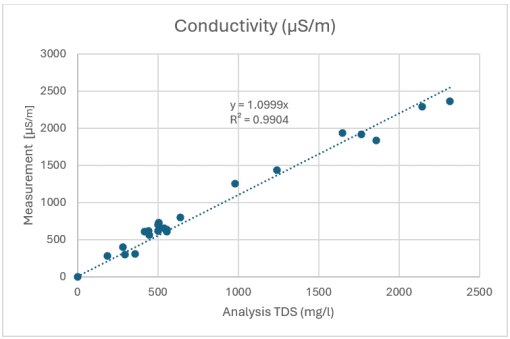
Figure 3: Correlation between conductivity measurement in µS/m and mineral content according to laboratory analysis in mg/l
Overall, this results in a very high correlation value of R² = 0.9889 (Figure 2). A comparable analysis using laboratory measurements of electrical conductivity yields an R² of 0.9904 – almost identical to the density measurement (Figure 3). From a measurement technology perspective, density measurement is therefore a reliable alternative to classic conductivity measurement.
Finally, seawater from the Mediterranean Sea was also examined as an example of a medium with a significantly higher mineral content. At 20°C, a density was measured that was 27,637 mg/l higher than that of distilled water. Applying the determined correlation results in an estimated mineral content of around 30 g/l – slightly below the actual value of 36–39 g/l. Since sodium chloride is known to be the main component, the specific concentration model of the DLO-M2 could be used for NaCl. The result of 3.88% (w/w) is very close to the expected value.
This series of measurements shows that the DLO-M2 is not only suitable for analyzing drinking and factory water with low mineral content but also delivers reliable results for highly concentrated salt solutions.
Conclusion
The measurements taken show that the DLO-M2 exhibits a high degree of consistency with the precise laboratory device DSA 5000 M, confirming its measurement accuracy regarding density. The conversion of density values into mineral content using the existing concentration model yields plausible results, although certain deviations from the declarations occur. These can be explained by natural fluctuations and the different chemical composition of the minerals.
The correlation determined between density and mineral content shows high statistical quality (R² = 0.9889) and is comparable to that of the conductivity measurement (R² = 0.9904). This makes density measurement a reliable alternative to conventional conductivity measurement. This alternative can even offer added value, particularly in applications such as beer brewing, where the density value itself is also relevant.
Our DLO-M2 also delivers good results with highly mineralized media such as seawater, especially if the main component is known and a specific concentration model is used. This underscores the versatility of the DLO-M2 for both drinking water analysis and any other salt solutions.
Want to take control of the water quality in your brewery or beverage production facility? Get in touch with us!

Which sensors were used?
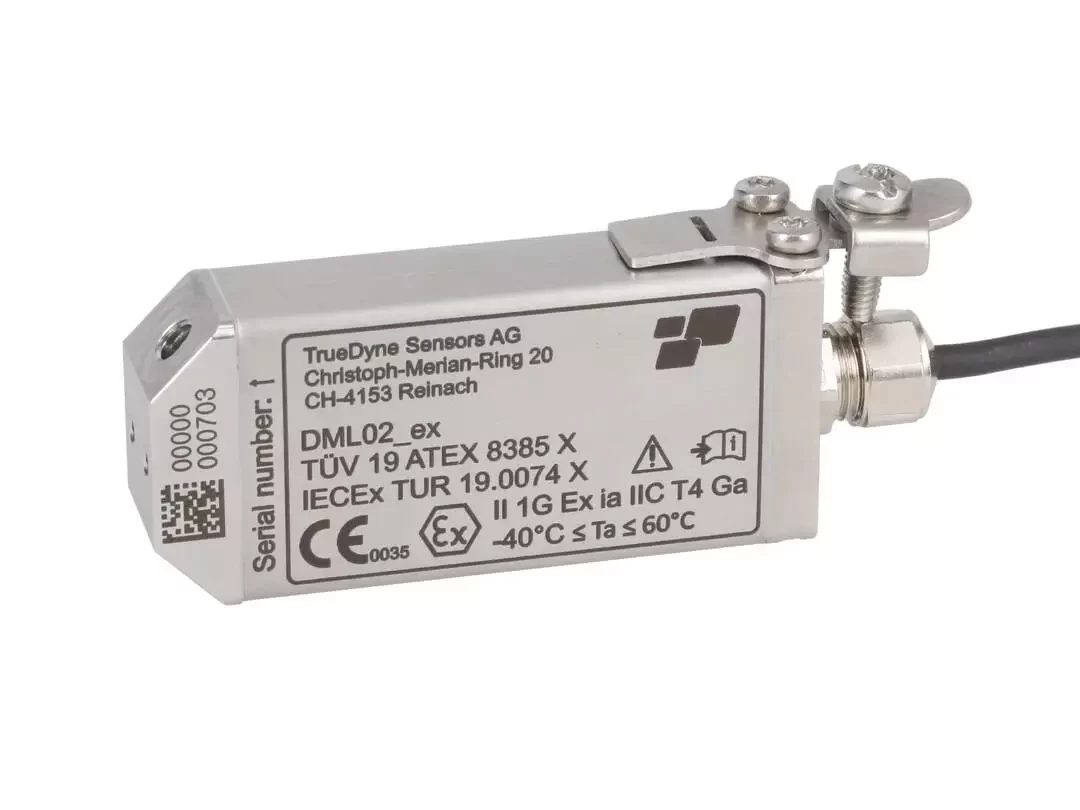
density sensor DLO-M2
- Click here to learn more about our sensor
Sensors that might interest you
Gases
Viscosity
Applications that might interest you


From volume (l)
to mass (kg)


More Winks of Knowledge that might interest you
Article: In-line measurements of the physical and thermodynamic properties of single and multicomponent liquids
Microfluidic devices are becoming increasingly important in various fields of pharmacy, flow chemistry and healthcare. In the embedded microchannel, the flow rates, the dynamic viscosity of the transported liquids and the fluid dynamic properties play an important role. Various functional auxiliary components of microfluidic devices such as flow restrictors, valves and flow meters need to be characterised with liquids used in several microfluidic applications.

Article: Density and Concentration Measurement Applications for Novel MEMS-based Micro Densitometer for Gas
Density and Concentration Measurement Applications for Novel MEMS-based Micro Densitometer for GasC. Huber, TrueDyne Sensors AG, Reinach BL (Switzerland), Endress+Hauser Flowtec, Reinach BL (Switzerland)Abstract A MEMS cantilever based resonant device for gas...

Article: Design, Simulation, Fabrication and Characterization of piezoelectric MEMS Cantilever for Gas Density and Viscosity Sensors Applications
Design, Simulation, Fabrication and Characterization of piezoelectric MEMS Cantilever for Gas Density and Viscosity Sensors ApplicationsA. Mehdaoui¹, C. Huber¹, J. Becker¹, F. Schraner¹, L. Villanueva² ¹TrueDyne Sensors AG, Reinach BL (Switzerland), ²Ecole...

Article: Multiparameter Gas-Monitoring System
The aim of the study is to develop a compact, robust and maintenance free gas concentration and humidity monitoring system for industrial use in the field of inert process gases. Our multiparameter gas-monitoring system prototype allows the simultaneous measurement of the fluid physical properties (density, viscosity) and water vapor content (at ppm level) under varying process conditions.

Part 3 – MEMS technology
MEMS technologyAt a glance In the previous section (part 2) we got to know the vibration measuring method. This section deals with the establishment of MEMS technology at TrueDyne Sensors AG. The technology has brought about the MEMS sensor, the heart of which is an...
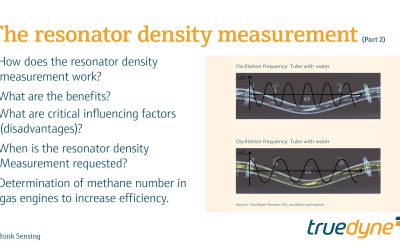
Part 2 – The resonator density measurement
The resonator density measurement At a glance In the previous part (1) we learned about the basics of density measurement and the definition of density. This section is dedicated to the vibration method which is also used by density sensors for density measurement....