Winkle of Knowledge: Concentration measurement protein
This knowledge wink is dedicated to measuring the concentration of protein in water using the physical parameters of density and viscosity. Commercially available whey protein was used as an example, the concentration of which we were able to determine in the range of ±0.07 %w using a VLO-M2. Our shake is now perfect, and we are also happy to help you optimize your protein solutions!
Why this test?
Have you ever wondered why the gains don’t materialise despite hard training in the gym? Have you ever suspected the protein shake? Who knows how much protein is really in there, especially if you don’t meticulously weigh everything… With a VLO-M2 density and viscosity sensor, we set out in search of answers. In the spirit of ‘Dry January’, this wink of knowledge is not dedicated to alcoholic drinks for once, but to whey protein.
But quite apart from the fun factor involved in mixing, measuring and drinking protein shakes: Aqueous protein solutions are not only used in the production of whey products, e.g. for the fitness industry, but are also important pillars of the modern biotech and pharmaceutical industries. Whey protein is a cost-effective way to enter the diverse world of proteins.
What is a Wink of Knowledge?
Do you need to quickly measure, draw or do/build something? The speed with which the result may be achieved counts more than the perfect (scientific) approach. For this reason, we have introduced the Wink of Knowledge. Science in the wink of an eye, so to speak. We don’t want to prove anything scientifically. We simply want to quickly demonstrate something pragmatically. If you are interested, we would be happy to discuss these results in more detail with you and your project.
Results
Mixtures with different concentrations of commercially available whey protein isolate in water were prepared using a balance. The concentrations were chosen to cover the range close to the manufacturer’s recommendation. The recommendation is to dissolve 25g of powder (which corresponds to approx. 3 level tablespoons) in 300 ml of water. Assuming a density of approx. 1kg/l for water, this corresponds to a concentration of approx. 8.3 %w. Our mixtures ranged accordingly from 4.5 %w to 12.5 %w. The density and viscosity of these mixtures were measured with a VLO-M2 at ambient conditions (approx. 24°C, atmospheric pressure) and yielded the following concentration dependencies (blue dots):


Conclusion
Mixtures of whey protein and water in the range of 4.5 %w to 12.5 %w were measured for density and viscosity, and a clear concentration dependence was found. Assuming a linear fit for the density data, we would expect a concentration measurement with approx. ±0.07 %w accuracy for the VLO-M2. It would be interesting to measure other proteins that are found in relevant concentrations in the medical or pharmaceutical sector, for example.
In addition, we were able to optimize our protein shake recipe by using, measuring and comparing the preparation recommendation: TrueDyne Sensors AG now recommends increasing the dose by 50% to 4.5 tablespoons of protein powder per 300 ml of water when using the non-calibrated measuring device “tablespoon from the TrueDyne drawer”.
Which sensors were used?

viscosity sensor VLO-M2
- Click here to learn more about our sensor
Sensors that might interest you
Gases
Viscosity
Applications that might interest you


From volume (l)
to mass (kg)


More Winks of Knowledge that might interest you
Article: In-line measurements of the physical and thermodynamic properties of single and multicomponent liquids
Microfluidic devices are becoming increasingly important in various fields of pharmacy, flow chemistry and healthcare. In the embedded microchannel, the flow rates, the dynamic viscosity of the transported liquids and the fluid dynamic properties play an important role. Various functional auxiliary components of microfluidic devices such as flow restrictors, valves and flow meters need to be characterised with liquids used in several microfluidic applications.

Article: Density and Concentration Measurement Applications for Novel MEMS-based Micro Densitometer for Gas
Density and Concentration Measurement Applications for Novel MEMS-based Micro Densitometer for GasC. Huber, TrueDyne Sensors AG, Reinach BL (Switzerland), Endress+Hauser Flowtec, Reinach BL (Switzerland)Abstract A MEMS cantilever based resonant device for gas...

Article: Design, Simulation, Fabrication and Characterization of piezoelectric MEMS Cantilever for Gas Density and Viscosity Sensors Applications
Design, Simulation, Fabrication and Characterization of piezoelectric MEMS Cantilever for Gas Density and Viscosity Sensors ApplicationsA. Mehdaoui¹, C. Huber¹, J. Becker¹, F. Schraner¹, L. Villanueva² ¹TrueDyne Sensors AG, Reinach BL (Switzerland), ²Ecole...

Article: Multiparameter Gas-Monitoring System
The aim of the study is to develop a compact, robust and maintenance free gas concentration and humidity monitoring system for industrial use in the field of inert process gases. Our multiparameter gas-monitoring system prototype allows the simultaneous measurement of the fluid physical properties (density, viscosity) and water vapor content (at ppm level) under varying process conditions.

Part 3 – MEMS technology
MEMS technologyAt a glance In the previous section (part 2) we got to know the vibration measuring method. This section deals with the establishment of MEMS technology at TrueDyne Sensors AG. The technology has brought about the MEMS sensor, the heart of which is an...
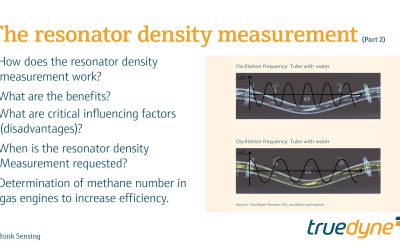
Part 2 – The resonator density measurement
The resonator density measurement At a glance In the previous part (1) we learned about the basics of density measurement and the definition of density. This section is dedicated to the vibration method which is also used by density sensors for density measurement....