Wink of Knowledge: Monitoring the beer fermentation process via density and CO2 formation
Why this test?
Density is already measured in most breweries for monitoring the fermentation process and determining the final alcohol content. Especially in micro and small breweries, this is usually still done by using a hydrometer. For this purpose, a sample must be taken from the fermentation tank for each measuring point, which is then used for measurement. To be able to follow the fermentation process, many measurements are required, which requires a significant amount of time and beer. In this Wink of Knowledge we present two automatable alternatives, on the one hand the direct inline density measurement by means of DLO-M2 and on the other hand the (flow) measurement of the formed CO2 with a DGF-SFS module.
What is a Wink of Knowledge?
Do you need to quickly measure, draw or do/build something? The speed with which the result may be achieved counts more than the perfect (scientific) approach. For this reason, we have introduced the Wink of Knowledge. Science in the wink of an eye, so to speak. We don’t want to prove anything scientifically. We simply want to quickly demonstrate something pragmatically. If you are interested, we would be happy to discuss these results in more detail with you and your project.
Results
The density of the wort (original extract) was measured and found to be 15.82° Plato according to the DLO-M2 with proprietary concentration package. The verification measurement with the laboratory instrument DSA 5000 M (Anton Paar) gave 15.75 °Plato which is in excellent agreement (typical measurement errors with a hydrometer are in the range 0.1° Plato – 0.2° Plato for skilled users, with common handheld instruments at 0.25°Plato). The density curve was measured continuously throughout the fermentation process and is shown together with the apparent extract calculated from it on Figure 1. The progression is as expected: After a short, stable start-up phase, the reaction accelerates before running into saturation and the fermentation process finally comes to a halt again.

Figure 1: Progression of density and apparent extract during the fermentation process.
The opposite behavior can be observed for the alcohol content, which can also be calculated from these data (Figure 2).

Figure 2: Course of alcohol content and real extract during the fermentation process.
Thus, all relevant parameters of beer fermentation could be monitored in real time by density measurement. Extract as well as alcohol content of the finished beer could also be determined.
The second way to monitor the same parameters is to measure the escaping CO2, since it is formed in a fixed stoichiometric ratio to the ethanol:
C6H1206 -> 2 C2H5OH+ 2CO2
Or as a mass balance in g/mol:
180.16 -> 2 * 46.07 + 2* 44.01
The summed-up CO2 flow, measured by means of the SFS-DGF module, yields the total amount of CO2 formed, from which the total mass of alcohol and thus the alcohol content can also be deduced according to the above formula. In the experiment, the total measured CO2 flux turned out to be 1.29 times lower than expected according to the density measurement (Figure 3, Figure 4 then shows the correspondingly corrected back calculation of the extract/alcohol content). The reaction course is very well represented by the flow measurement, so that a control of the fermentation process using the correction factor would already be possible.
")
Figure 3: Measured CO2 flux compared to expected CO2 flux (according to density data)

Figure 4: Back calculation of the alcohol content as well as the extract from the CO2 flow measurement with correction factor
Besides small leakages, a reason for the lower CO2 stream in our measurements could be the humidity and the ethanol content in the measured gas (a thermal measuring principle was used, which is sensitive to the gas composition). Therefore, an additional determination of the humidity and the ethanol content is recommended for future measurements. The former can be accomplished by means of an additional HYT humidity module. After measuring the humidity, the already used DGF density sensor can then determine the concentration of the remaining two components, CO2 and ethanol. Thus, the thermal flow signal of the SFS flow module can be corrected and the actual amount of CO2 formed can be determined more accurately.
Which sensors were used?

density sensor DLO-M2
- Click here to learn more about our sensor.

Density sensor DGF-i1
- Click here to learn more about our sensor

mass flow sensor SFS01
- Click here to learn more about the mass flow sensor of the IST AG.
Procedure
Wort (15.75 °Plato) was filled into a 3l lab bottle and fermented within < 2 days by adding yeast (many thanks to Severin Ramseyer for wort + yeast). During this process, the mixture was continuously pumped through a DLO-M2 density sensor using a 140um mesh filter. At the same time, the resulting CO2 was passed through a wash bottle (filled with water) to a DGF-SFS module. The module was set to a mixture of air+CO2. In both cases, the data were logged using “Remote Control” software and a laptop. The entire setup can be seen in Figure 5.

Figure 5: Test setup
Conclusion
A continuous density measurement using DLO-M2 was successfully implemented to follow the beer fermentation process. Extract as well as alcohol content of the finished product could be determined. The flow measurement of the resulting CO2 agreed qualitatively very well with the density measurement and could also be used to control the fermentation process. For quantitative back-calculation to alcohol content and extract from the flow data, a correction factor must be used for the time being. In the future, however, a measurement of the humidity and ethanol content in the CO2 stream will be made to determine the CO2 content more accurately.
Sensors that might interest you
Gases
Viscosity
Applications that might interest you


From volume (l)
to mass (kg)


More Winks of Knowledge that might interest you
Article: In-line measurements of the physical and thermodynamic properties of single and multicomponent liquids
Microfluidic devices are becoming increasingly important in various fields of pharmacy, flow chemistry and healthcare. In the embedded microchannel, the flow rates, the dynamic viscosity of the transported liquids and the fluid dynamic properties play an important role. Various functional auxiliary components of microfluidic devices such as flow restrictors, valves and flow meters need to be characterised with liquids used in several microfluidic applications.

Article: Density and Concentration Measurement Applications for Novel MEMS-based Micro Densitometer for Gas
Density and Concentration Measurement Applications for Novel MEMS-based Micro Densitometer for GasC. Huber, TrueDyne Sensors AG, Reinach BL (Switzerland), Endress+Hauser Flowtec, Reinach BL (Switzerland)Abstract A MEMS cantilever based resonant device for gas...

Article: Design, Simulation, Fabrication and Characterization of piezoelectric MEMS Cantilever for Gas Density and Viscosity Sensors Applications
Design, Simulation, Fabrication and Characterization of piezoelectric MEMS Cantilever for Gas Density and Viscosity Sensors ApplicationsA. Mehdaoui¹, C. Huber¹, J. Becker¹, F. Schraner¹, L. Villanueva² ¹TrueDyne Sensors AG, Reinach BL (Switzerland), ²Ecole...

Article: Multiparameter Gas-Monitoring System
The aim of the study is to develop a compact, robust and maintenance free gas concentration and humidity monitoring system for industrial use in the field of inert process gases. Our multiparameter gas-monitoring system prototype allows the simultaneous measurement of the fluid physical properties (density, viscosity) and water vapor content (at ppm level) under varying process conditions.

Part 3 – MEMS technology
MEMS technologyAt a glance In the previous section (part 2) we got to know the vibration measuring method. This section deals with the establishment of MEMS technology at TrueDyne Sensors AG. The technology has brought about the MEMS sensor, the heart of which is an...
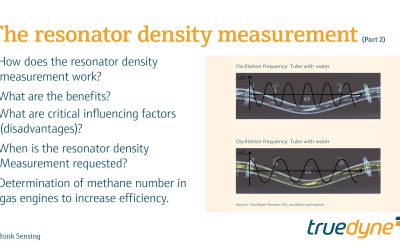
Part 2 – The resonator density measurement
The resonator density measurement At a glance In the previous part (1) we learned about the basics of density measurement and the definition of density. This section is dedicated to the vibration method which is also used by density sensors for density measurement....