Wink of Knowledge: Measurement of the hydrogen peroxide concentration in water with <0.025% measurement uncertainty
Why this test?
Hydrogen peroxide is used in areas such as medicine, the food industry, pharmaceutical technology and biology for the decontamination and sterilisation of all surfaces. Applications on the human body, e.g. for disinfection, are also widespread. In order to be effective on the one hand, but to avoid showing any undesirable side effects on the other, the hydrogen peroxide must be present in the right concentration. Correct dosing is rendered complicated by the spontaneous decomposition of hydrogen peroxide in water + oxygen. To ensure that the hydrogen peroxide is always present in the desired concentration, continuous measurement is recommended. Density can be used as a measurand for determining the concentration of aqueous hydrogen peroxide solutions, and this Wink of Knowledge is therefore concerned with the extent to which this measurement can be accurately achieved under typical conditions.
What is a Wink of Knowledge?
Do you need to quickly measure, draw or do/build something? The speed with which the result may be achieved counts more than the perfect (scientific) approach. For this reason, we have introduced the Wink of Knowledge. Science in the wink of an eye, so to speak. We don’t want to prove anything scientifically. We simply want to quickly demonstrate something pragmatically. If you are interested, we would be happy to discuss these results in more detail with you and your project.
Results
The achievable measurement accuracy of the VLO-M2 was put to the test by comparing its density measurements to those of a laboratory instrument. In the case of (nominal) hydrogen peroxide concentrations between 0% and 6%, the following measurements were performed using the VLO-M2 and the laboratory instrument DSA 5000 M (Anton Paar) :
| Density measurement [kg/m 3 ] | |||
| Concentration [w/w%] | DSA 5000 M | VLO-M2 | Difference |
| 6.00% | 1017.068 | 1017.045 | -0.023 |
| 0.547% | 998.849 | 998.889 | 0.040 |
| 0.059% | 997.168 | 997.183 | 0.015 |
| 0.030% | 996.890 | 996.872 | -0.018 |
| 0% | 996.840 | 996.879 | 0.039 |
The difference between the laboratory unit and the VLO-M was 2 < 0.05 kg/m 3 over the entire concentration range. This is far below the VLO-M2’s specified measurement error of ± 0.2 kg/m 3 and closer to the specified measurement error of the laboratory instrument of ±0.007 kg/m3, as can be seen quite clearly in the following graphic :
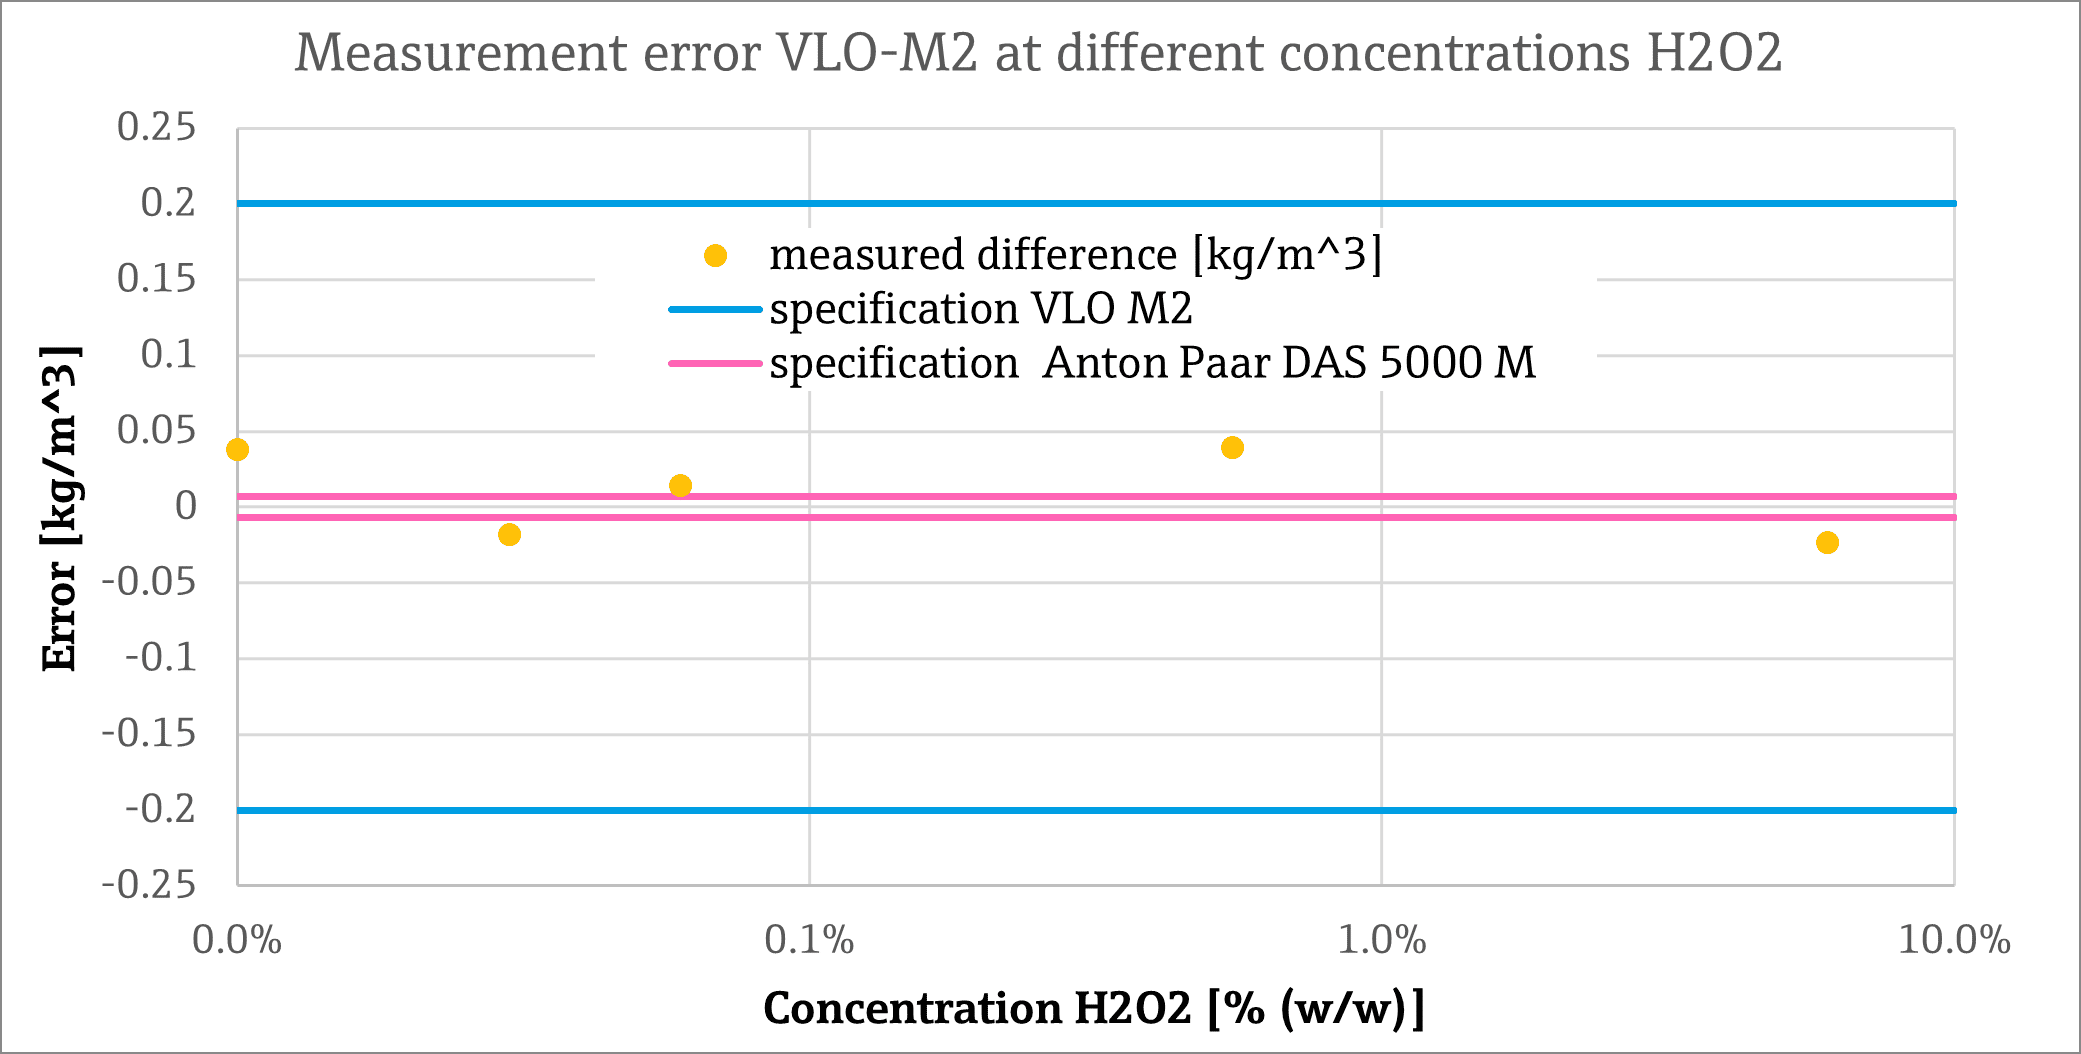
Converted to the density difference of 20.23 kg/m 3 between the 6% stock solution and deionised water, the maximum measured deviation of ±0. 04 kg/m 3 corresponds to an uncertainty in the concentration of <0.025% (250ppm) or < 0.0125% (125ppm). Although in reality, the dependence between concentration and density is not linear, this value provides a good indication.
Finally, the measured density difference between the measured hydrogen peroxide solutions and the theoretical value of pure water (according to REFPROP, NIST) is once again shown here graphically:

An almost identical offset to the reference value can be observed with both measuring methods, with pure deionised water and the lowest concentration of 0.03% H2O2. Possibleexplanations could include a rapid decay of H2O2 at very low concentrations or a weak influence of H2O2 on the density in this range. If the density were to increase in linear fashion, the laboratory instrument, at least, should be able to resolve the density difference between 0% and 0.03% without any problems, with the result that a measurement error would appear unlikely.
However, a clear increase in density is then observed with both instruments when the H2O2 concentration is doubled to 0.059% (note the logarithmic scales). Here, correspondence between the measurements is also excellent, which speaks for the measurement accuracy of the VLO-M2
Which sensors were used?

Density sensor VLO-M2
- Click here to learn more about our sensor.
Procedure
The VLO-M2 and the laboratory instrument DSA 5000 M (Anton Paar) were used to measure the densities of a hydrogen peroxide stock solution of 6% as well as the dilutions thereof, which consisted of 0.547%, 0.059%, 0.030% and 0% hydrogen peroxide in deionised water . Concentrations of <0.1% were volumetrically created and density to percentages by weight recalculated, and the higher concentration was weighed in directly. The measurements on the two devices took place simultaneously. The temperature on the laboratory unit was adjusted to the temperature in the VLO-M2 in order, to permit a direct comparison (25.2 – 25.7°C ). The VLO-M2 does not have active temperature stabilisation like the laboratory measuring device, and so the available data was averaged in a temperature window of ± 0.02°C and used accordingly.
Solution
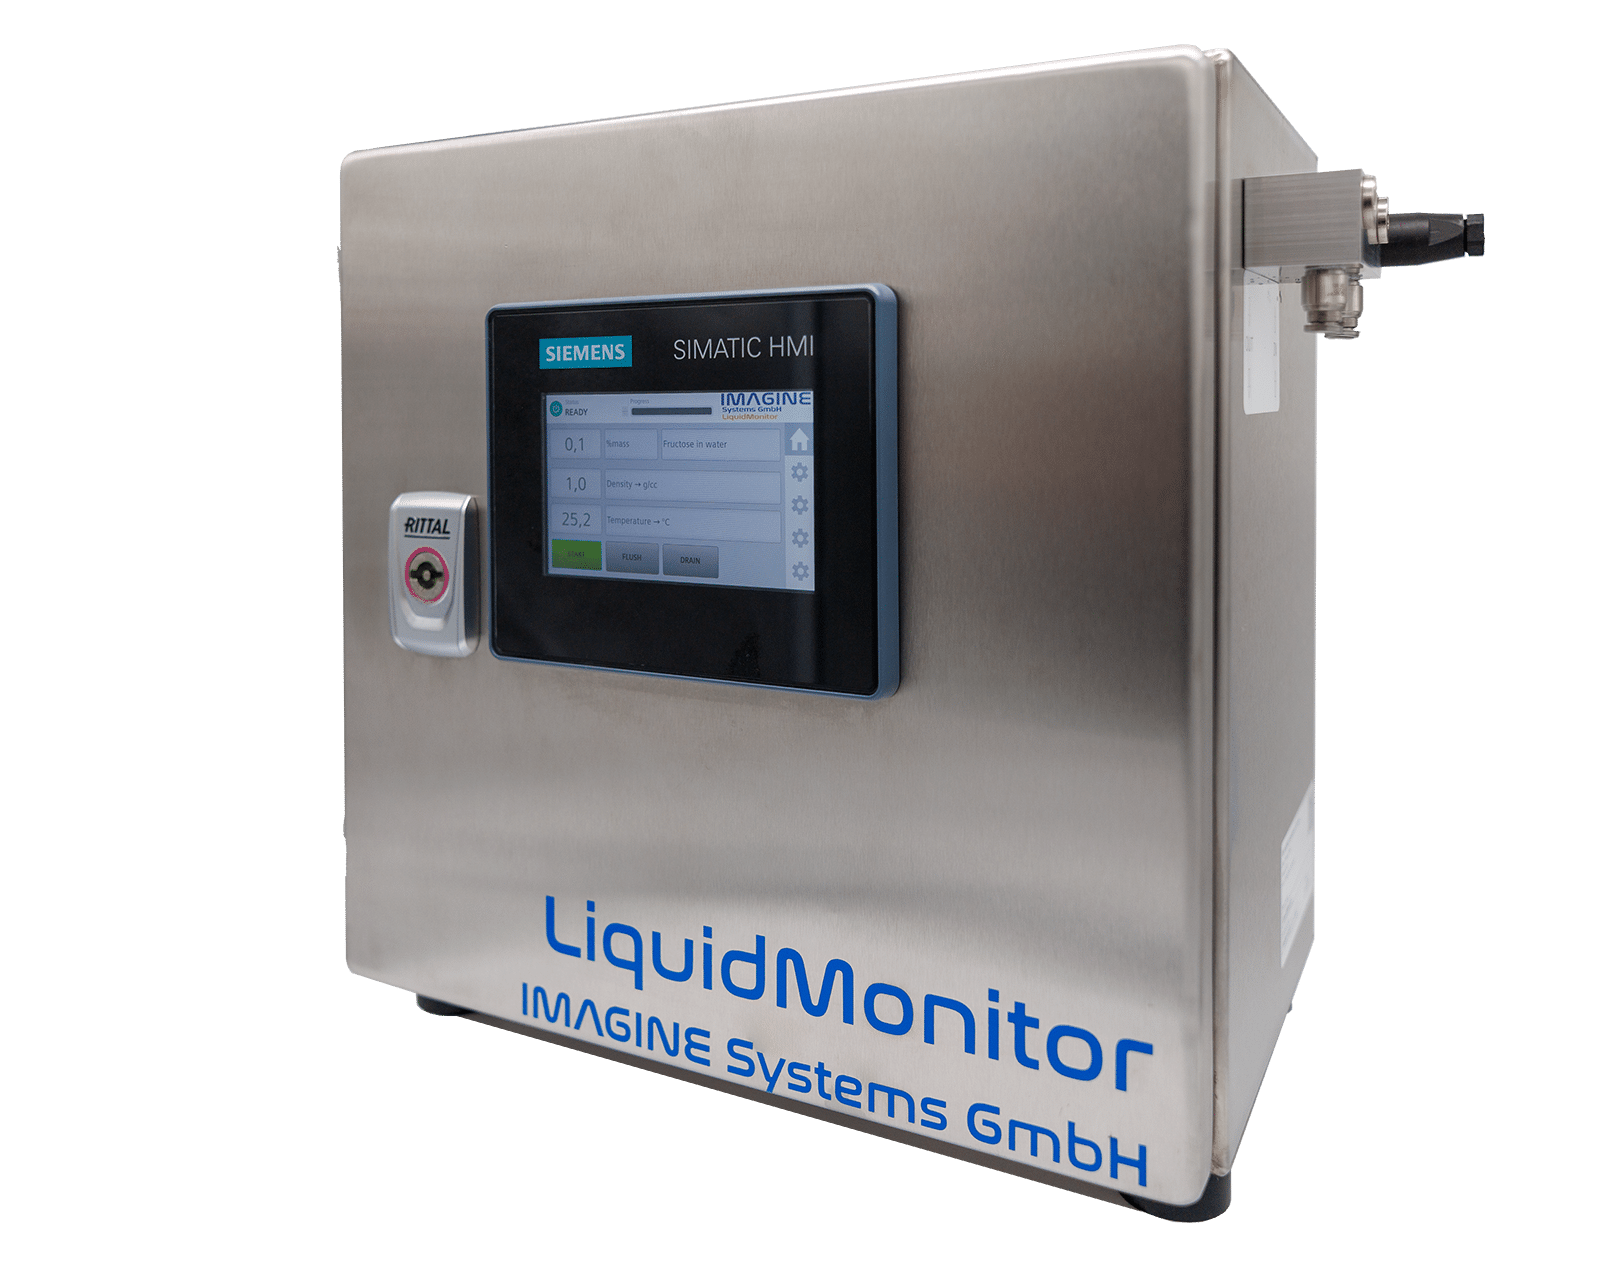
Sample system concentration measurement
- Click here to learn more about our system.
In close collaboration with Imagine Systems, a compact and intelligent analysis device was developed that combines high precision with ease of use. The integration of MEMS technology and smart sample control makes the system a powerful solution for real-time concentration and density measurement.
The system features an integrated controller that enables automated sampling, pump control, and analysis functions. Samples can be conveniently drawn from any container—ideal for laboratory applications, process monitoring, or mobile use.
Summary
This test answers the question regarding the measurement accuracy of the VLO-M2 with aqueous hydrogen peroxide solutions from 0% – 6% under ambient conditions : The measurement error was < 0.05 kg/m 3 when we performed our test. This is far below the specified ± 0.2 kg/m 3 for the VLO-M2 . Since the specification at extreme temperatures, from -40 °C to 6 0 °C and in the entire density ranges from 0 kg/m 3 up to 1200 kg/m 3 must be complied with , the measurement error with aqueous solutions and temperatures close to room temperature can be many times smaller, as shown here . The measured errors (<0.025%) correspond approximately to an accuracy of 250 ppm for the determination of the concentration of H2O2 in water which, in the case of many applications of this mixture, is more than sufficient .
Sensors that might interest you
Gases
Viscosity
Applications that might interest you


From volume (l)
to mass (kg)


More Winks of Knowledge that might interest you
Article: In-line measurements of the physical and thermodynamic properties of single and multicomponent liquids
Microfluidic devices are becoming increasingly important in various fields of pharmacy, flow chemistry and healthcare. In the embedded microchannel, the flow rates, the dynamic viscosity of the transported liquids and the fluid dynamic properties play an important role. Various functional auxiliary components of microfluidic devices such as flow restrictors, valves and flow meters need to be characterised with liquids used in several microfluidic applications.

Article: Density and Concentration Measurement Applications for Novel MEMS-based Micro Densitometer for Gas
Density and Concentration Measurement Applications for Novel MEMS-based Micro Densitometer for GasC. Huber, TrueDyne Sensors AG, Reinach BL (Switzerland), Endress+Hauser Flowtec, Reinach BL (Switzerland)Abstract A MEMS cantilever based resonant device for gas...

Article: Design, Simulation, Fabrication and Characterization of piezoelectric MEMS Cantilever for Gas Density and Viscosity Sensors Applications
Design, Simulation, Fabrication and Characterization of piezoelectric MEMS Cantilever for Gas Density and Viscosity Sensors ApplicationsA. Mehdaoui¹, C. Huber¹, J. Becker¹, F. Schraner¹, L. Villanueva² ¹TrueDyne Sensors AG, Reinach BL (Switzerland), ²Ecole...

Article: Multiparameter Gas-Monitoring System
The aim of the study is to develop a compact, robust and maintenance free gas concentration and humidity monitoring system for industrial use in the field of inert process gases. Our multiparameter gas-monitoring system prototype allows the simultaneous measurement of the fluid physical properties (density, viscosity) and water vapor content (at ppm level) under varying process conditions.

Part 3 – MEMS technology
MEMS technologyAt a glance In the previous section (part 2) we got to know the vibration measuring method. This section deals with the establishment of MEMS technology at TrueDyne Sensors AG. The technology has brought about the MEMS sensor, the heart of which is an...
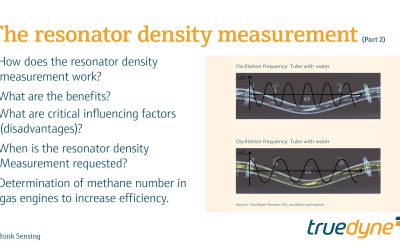
Part 2 – The resonator density measurement
The resonator density measurement At a glance In the previous part (1) we learned about the basics of density measurement and the definition of density. This section is dedicated to the vibration method which is also used by density sensors for density measurement....