Wink of Knowledge: Improved methanol/water concentration model for fuel cells
Why this test?
The methanol fuel cell is an important technology for the energy transition. Although today’s methanol production is still heavily dependent on fossil sources, renewable raw materials such as biogas, sewage sludge or even atmospheric CO2 are becoming increasingly important. A fuel cell such as the direct methanol fuel cell (DMFC) then generates electricity from this methanol in a similar way to a conventional generator. It is important for the efficient and safe operation of such fuel cells to feed in a methanol/water mixture with a constant concentration – the optimum concentration depends on the type of fuel cell. Process control is made more difficult by the incomplete conversion of the methanol. A varying proportion of the mixture exits the fuel cell unused and should be continuously recycled. Figure 1 shows the process schematically:
Figure 1: Schematic of a direct methanol fuel cell with various possible measuring points.
Providing a controlled mixture of the recyclate and a methanol stock solution is therefore a challenge. This is precisely where the concentration measurement using the DLO-M2 density sensor comes into play (orange measuring point 2 in Figure 1).
What is a Wink of Knowledge?
Do you need to quickly measure, draw or do/build something? The speed with which the result may be achieved counts more than the perfect (scientific) approach. For this reason, we have introduced the Wink of Knowledge. Science in the wink of an eye, so to speak. We don’t want to prove anything scientifically. We simply want to quickly demonstrate something pragmatically. If you are interested, we would be happy to discuss these results in more detail with you and your project.
Results
Existing data on aqueous methanol solutions were combined with our own measurements using a DSA 5000 M laboratory density meter (Anton Paar). The own measurements mainly included typical operating conditions of fuel cells such as concentrations <10% at temperatures >40°C.
The collected data was processed into a concentration model for our DLO-M2 density sensor. As a result, this can now calculate and output the methanol concentration of a solution directly from the measured density value with an accuracy of ±0.2%w/w:
Figure 2: Accuracy analysis of the new concentration model methanol in water according to %w/w
Of course, in addition to the model accuracy, the measuring accuracy of the sensor is also crucial. In the case of the VLO-M2, this is approx. ±0.2 kg/m3 for the mixtures under consideration (the DLO-M2 achieves a comparable performance after adjustment). For the entire concentration range and an example temperature of 25°C, the following picture emerges:
Figure 3: Overall accuracy of the measurement including the measuring accuracy of the DLO-M2 density sensor
In the complete measurement range of 0-100%w/w, the overall accuracy remains very good and is around ±0.3 %w/w (shaded gray in Figure 3). Thanks to the excellent measurement accuracy of the TrueDyne MEMS sensor technology, the error due to the density measurement affects the overall error in this case even less than the pure model accuracy (shown by the orange line at ± 0.2%w/w).
A new, much more accurate methanol/water concentration model has been integrated into the DML product family (DLO-M2 / VLO-M2). The background for this update is the increasing use of methanol as an energy source, for example for power supply via fuel cells. In combination with the high-precision density measurement of our sensor technology, the model enables real-time concentration monitoring of the methanol/water mixture and thus efficient and safe operation of the fuel cell. This enables optimum efficiency to be achieved with maximum service life of the fuel cell.
Microfluidic devices are becoming increasingly important in various fields of pharmacy, flow chemistry and healthcare. In the embedded microchannel, the flow rates, the dynamic viscosity of the transported liquids and the fluid dynamic properties play an important role. Various functional auxiliary components of microfluidic devices such as flow restrictors, valves and flow meters need to be characterised with liquids used in several microfluidic applications.
Density and Concentration Measurement Applications for Novel MEMS-based Micro Densitometer for GasC. Huber, TrueDyne Sensors AG, Reinach BL (Switzerland), Endress+Hauser Flowtec, Reinach BL (Switzerland)Abstract A MEMS cantilever based resonant device for gas...
Design, Simulation, Fabrication and Characterization of piezoelectric MEMS Cantilever for Gas Density and Viscosity Sensors ApplicationsA. Mehdaoui¹, C. Huber¹, J. Becker¹, F. Schraner¹, L. Villanueva² ¹TrueDyne Sensors AG, Reinach BL (Switzerland), ²Ecole...
The aim of the study is to develop a compact, robust and maintenance free gas concentration and humidity monitoring system for industrial use in the field of inert process gases. Our multiparameter gas-monitoring system prototype allows the simultaneous measurement of the fluid physical properties (density, viscosity) and water vapor content (at ppm level) under varying process conditions.
MEMS technologyAt a glance In the previous section (part 2) we got to know the vibration measuring method. This section deals with the establishment of MEMS technology at TrueDyne Sensors AG. The technology has brought about the MEMS sensor, the heart of which is an...
The resonator density measurementAt a glance In the previous part (1) we learned about the basics of density measurement and the definition of density. This section is dedicated to the vibration method which is also used by density sensors for density measurement....
With conventional thermal mass flow meters and controllers (MFM/MFC), associated parameters must be set manually for each specific gas or binary gas mixture.
In cooperation with Innovative Sensor Technology (IST AG), we are currently working on the development of a thermal flow meter called FGF. This module simultaneously measures density, temperature, pressure, and mass flow and calculates the derived measured variables in a single device. The density measurement enables the differentiation of pure gases and the determination of the concentration of binary gas mixtures. This allows the measured flow rate to be corrected and the mass flow to be converted into a volume flow in real time. This means that a sensor with a single, generic gas calibration can be used for (almost) any number of gases.
A prototype mass flow controller has now been developed based on the FGF. Thanks to the versatile and precise sensor technology, the volume flow can be controlled precisely and independently of the gas. The controller parameters of the valve are automatically optimized for the current gas or binary gas mixture.
What is a Wink of Knowledge?
Do you need to quickly measure, draw or do/build something? The speed with which the result may be achieved counts more than the perfect (scientific) approach. For this reason, we have introduced the Wink of Knowledge. Science in the wink of an eye, so to speak. We don’t want to prove anything scientifically. We simply want to quickly demonstrate something pragmatically. If you are interested, we would be happy to discuss these results in more detail with you and your project.
Results
After a series of measurements with the mass flow controller, it was found that there is a clear correlation between the ideal controller parameters and the density, as shown in Figure 1.
The correlation between the optimal controller parameters and the density is because gas becomes heavier with increasing density, which in turn leads to a slower reaction of the valve.
The current required to open the valve is significantly lower as the density of the gas increases. We also refer to this valve parameter as the zero offset. This is due to the fact that a heavier gas exerts more pressure on the valve when closed compared to a lighter gas.
With the help of the trend line function, the respective parameters for the controller and the zero-point offset can now be calculated. This means that all valve parameters for any gases or binary gas mixtures within a known density range can be optimally set without manual correction.
Figure 1: Density dependence of the parameters
Figure 2 shows the difference between the measured flow rate of our MFC prototype, without specific parameters for the gas mixture, compared to a conventional mass flow controller for a binary mixture of 50% nitrogen and 50% carbon dioxide.
The orange measurement curve clearly shows that the controller of the conventional MFC does not settle into a stable state, especially at higher flow rates. Thanks to the integrated density measurement and concentration determination of the FGF, the optimal valve parameters are set automatically. This results in short settling times and a stable flow control, which can be seen in the red measurement curve, independent of the mixing ratio over the entire flow range – a patented world first!
Figure 2: Measured flowof our MFC prototype and a conventional MFC
Click here to learn more about the mass flow sensor of the IST AG.
The density measurement, on which the clean gas detection and concentration determination is based, was carried out with the DGF density sensor for gases from TrueDyne Sensors AG.
The gas flow and its direction were determined using the SFS01 thermal flow sensor from IST AG.
Conclusion
Our prototype of a mass flow controller based on the FGF shows clear advantages in the gas-dependent control of flow rates compared to conventional MFCs. By automatically adjusting the valve parameters depending on the density, the mass flow can be controlled precisely and independently of the gas. This enables stable, flexible, and precise flow–measurement and –control in a wide range of applications without having to adjust any parameters manually.
Microfluidic devices are becoming increasingly important in various fields of pharmacy, flow chemistry and healthcare. In the embedded microchannel, the flow rates, the dynamic viscosity of the transported liquids and the fluid dynamic properties play an important role. Various functional auxiliary components of microfluidic devices such as flow restrictors, valves and flow meters need to be characterised with liquids used in several microfluidic applications.
Density and Concentration Measurement Applications for Novel MEMS-based Micro Densitometer for GasC. Huber, TrueDyne Sensors AG, Reinach BL (Switzerland), Endress+Hauser Flowtec, Reinach BL (Switzerland)Abstract A MEMS cantilever based resonant device for gas...
Design, Simulation, Fabrication and Characterization of piezoelectric MEMS Cantilever for Gas Density and Viscosity Sensors ApplicationsA. Mehdaoui¹, C. Huber¹, J. Becker¹, F. Schraner¹, L. Villanueva² ¹TrueDyne Sensors AG, Reinach BL (Switzerland), ²Ecole...
The aim of the study is to develop a compact, robust and maintenance free gas concentration and humidity monitoring system for industrial use in the field of inert process gases. Our multiparameter gas-monitoring system prototype allows the simultaneous measurement of the fluid physical properties (density, viscosity) and water vapor content (at ppm level) under varying process conditions.
MEMS technologyAt a glance In the previous section (part 2) we got to know the vibration measuring method. This section deals with the establishment of MEMS technology at TrueDyne Sensors AG. The technology has brought about the MEMS sensor, the heart of which is an...
The resonator density measurementAt a glance In the previous part (1) we learned about the basics of density measurement and the definition of density. This section is dedicated to the vibration method which is also used by density sensors for density measurement....
Wink of Knowledge: Monitoring the beer fermentation process via density and CO2 formation
Why this test?
Density is already measured in most breweries for monitoring the fermentation process and determining the final alcohol content. Especially in micro and small breweries, this is usually still done by using a hydrometer. For this purpose, a sample must be taken from the fermentation tank for each measuring point, which is then used for measurement. To be able to follow the fermentation process, many measurements are required, which requires a significant amount of time and beer. In this Wink of Knowledge we present two automatable alternatives, on the one hand the direct inline density measurement by means of DLO-M2 and on the other hand the (flow) measurement of the formed CO2 with a DGF-SFS module.
What is a Wink of Knowledge?
Do you need to quickly measure, draw or do/build something? The speed with which the result may be achieved counts more than the perfect (scientific) approach. For this reason, we have introduced the Wink of Knowledge. Science in the wink of an eye, so to speak. We don’t want to prove anything scientifically. We simply want to quickly demonstrate something pragmatically. If you are interested, we would be happy to discuss these results in more detail with you and your project.
Results
The density of the wort (original extract) was measured and found to be 15.82° Plato according to the DLO-M2 with proprietary concentration package. The verification measurement with the laboratory instrument DSA 5000 M (Anton Paar) gave 15.75 °Plato which is in excellent agreement (typical measurement errors with a hydrometer are in the range 0.1° Plato – 0.2° Plato for skilled users, with common handheld instruments at 0.25°Plato). The density curve was measured continuously throughout the fermentation process and is shown together with the apparent extract calculated from it on Figure 1. The progression is as expected: After a short, stable start-up phase, the reaction accelerates before running into saturation and the fermentation process finally comes to a haltagain.
Figure 1: Progression of density and apparent extract during the fermentation process.
The opposite behavior can be observed for the alcohol content, which can also be calculated from these data (Figure 2).
Figure 2: Course of alcohol content and real extract during the fermentation process.
Thus, all relevant parameters of beer fermentation could be monitored in real time by density measurement. Extract as well as alcohol content of the finished beer could also be determined.
The second way to monitor the same parameters is to measure the escaping CO2, since it is formed in a fixed stoichiometric ratio to the ethanol:
C6H1206 -> 2 C2H5OH+ 2CO2
Or as a mass balance in g/mol:
180.16 -> 2 * 46.07 + 2* 44.01
The summed-up CO2 flow, measured by means of the SFS-DGF module, yields the total amount of CO2 formed, from which the total mass of alcohol and thus the alcohol content can also be deduced according to the above formula. In the experiment, the total measured CO2 flux turned out to be 1.29 times lower than expected according to the density measurement (Figure 3, Figure 4 then shows the correspondingly corrected back calculation of the extract/alcohol content). The reaction course is very well represented by the flow measurement, so that a control of the fermentation process using the correction factor would already be possible.
Figure 3: Measured CO2 flux compared to expected CO2 flux (according to density data)
Figure 4: Back calculation of the alcohol content as well as the extract from the CO2 flow measurement with correction factor
Besides small leakages, areason for the lower CO2 stream in our measurements could be the humidity and the ethanol content in the measured gas (a thermal measuring principle was used, which is sensitive to the gas composition). Therefore, an additional determination of the humidityand the ethanol content is recommended for future measurements. The former can be accomplishedby means of an additional HYT humidity module. After measuring the humidity, the already used DGF density sensor can then determine the concentration of the remaining two components,CO2 and ethanol. Thus, the thermal flow signal of the SFS flow module can be corrected and the actual amount of CO2 formed can be determined more accurately.
Click here to learn more about the mass flow sensor of the IST AG.
Procedure
Wort (15.75 °Plato) was filled into a 3l lab bottle and fermented within < 2 days by adding yeast (many thanks to Severin Ramseyer for wort + yeast). During this process, the mixture was continuously pumped through a DLO-M2 density sensor using a 140um mesh filter. At the same time, the resulting CO2 was passed through a wash bottle (filled with water) to a DGF-SFS module. The module was set to a mixture of air+CO2. In both cases, the data were logged using “Remote Control” softwareand a laptop. The entire setup can be seen in Figure 5.
Figure 5: Test setup
Conclusion
A continuous density measurement using DLO-M2 was successfully implemented to follow the beer fermentation process.Extract as well as alcohol content of the finished product could be determined. The flow measurement of the resulting CO2 agreed qualitatively very well with the density measurement and could also be used to control the fermentation process. For quantitative back-calculation to alcohol content and extract from the flow data, a correction factor must be used for the time being. In the future, however, a measurement of the humidity and ethanol content in the CO2 stream will be made to determine the CO2 content more accurately.
Microfluidic devices are becoming increasingly important in various fields of pharmacy, flow chemistry and healthcare. In the embedded microchannel, the flow rates, the dynamic viscosity of the transported liquids and the fluid dynamic properties play an important role. Various functional auxiliary components of microfluidic devices such as flow restrictors, valves and flow meters need to be characterised with liquids used in several microfluidic applications.
Density and Concentration Measurement Applications for Novel MEMS-based Micro Densitometer for GasC. Huber, TrueDyne Sensors AG, Reinach BL (Switzerland), Endress+Hauser Flowtec, Reinach BL (Switzerland)Abstract A MEMS cantilever based resonant device for gas...
Design, Simulation, Fabrication and Characterization of piezoelectric MEMS Cantilever for Gas Density and Viscosity Sensors ApplicationsA. Mehdaoui¹, C. Huber¹, J. Becker¹, F. Schraner¹, L. Villanueva² ¹TrueDyne Sensors AG, Reinach BL (Switzerland), ²Ecole...
The aim of the study is to develop a compact, robust and maintenance free gas concentration and humidity monitoring system for industrial use in the field of inert process gases. Our multiparameter gas-monitoring system prototype allows the simultaneous measurement of the fluid physical properties (density, viscosity) and water vapor content (at ppm level) under varying process conditions.
MEMS technologyAt a glance In the previous section (part 2) we got to know the vibration measuring method. This section deals with the establishment of MEMS technology at TrueDyne Sensors AG. The technology has brought about the MEMS sensor, the heart of which is an...
The resonator density measurementAt a glance In the previous part (1) we learned about the basics of density measurement and the definition of density. This section is dedicated to the vibration method which is also used by density sensors for density measurement....
Wink of Knowledge: Measurement of the hydrogen peroxide concentration in water with <0.025% measurement uncertainty
Why this test?
Hydrogen peroxide is used in areas such as medicine, the foodindustry,pharmaceutical technology and biology for the decontamination and sterilisation of all surfaces. Applications on the human body, e.g. for disinfection, are also widespread. In order to be effective on the one hand, but to avoid showing any undesirable side effects on the other, the hydrogen peroxide must be present in the right concentration. Correct dosing is rendered complicated by the spontaneous decomposition of hydrogen peroxide in water + oxygen. To ensure that the hydrogen peroxide is always present in the desired concentration, continuous measurement is recommended. Density can be used as a measurand for determining the concentration of aqueous hydrogen peroxide solutions, and this Wink of Knowledge is therefore concerned with the extent to which this measurement can be accurately achieved under typical conditions.
What is a Wink of Knowledge?
Do you need to quickly measure, draw or do/build something? The speed with which the result may be achieved counts more than the perfect (scientific) approach. For this reason, we have introduced the Wink of Knowledge. Science in the wink of an eye, so to speak. We don’t want to prove anything scientifically. We simply want to quickly demonstrate something pragmatically. If you are interested, we would be happy to discuss these results in more detail with you and your project.
Results
The achievable measurement accuracy of the VLO-M2 was put to the test by comparing its density measurements to those of a laboratory instrument. In the case of(nominal) hydrogenperoxide concentrations between 0% and 6%, the following measurements were performed using the VLO-M2 and the laboratory instrument DSA 5000 M (Anton Paar) :
Density measurement [kg/m3]
Concentration [w/w%]
DSA 5000 M
VLO-M2
Difference
6.00%
1017.068
1017.045
-0.023
0.547%
998.849
998.889
0.040
0.059%
997.168
997.183
0.015
0.030%
996.890
996.872
-0.018
0%
996.840
996.879
0.039
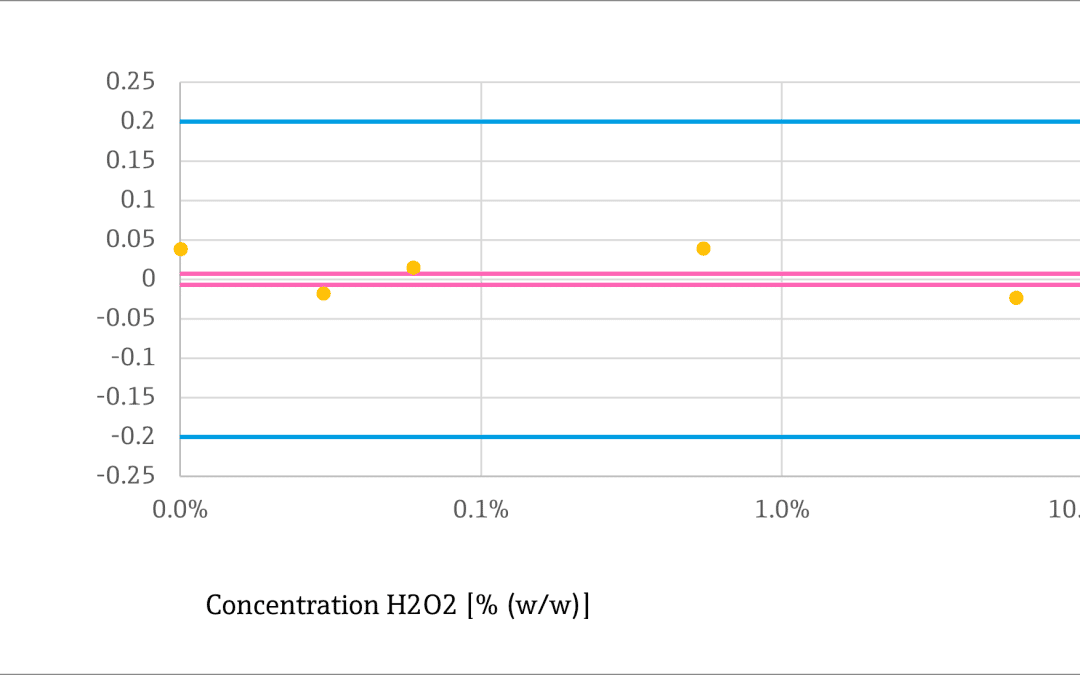
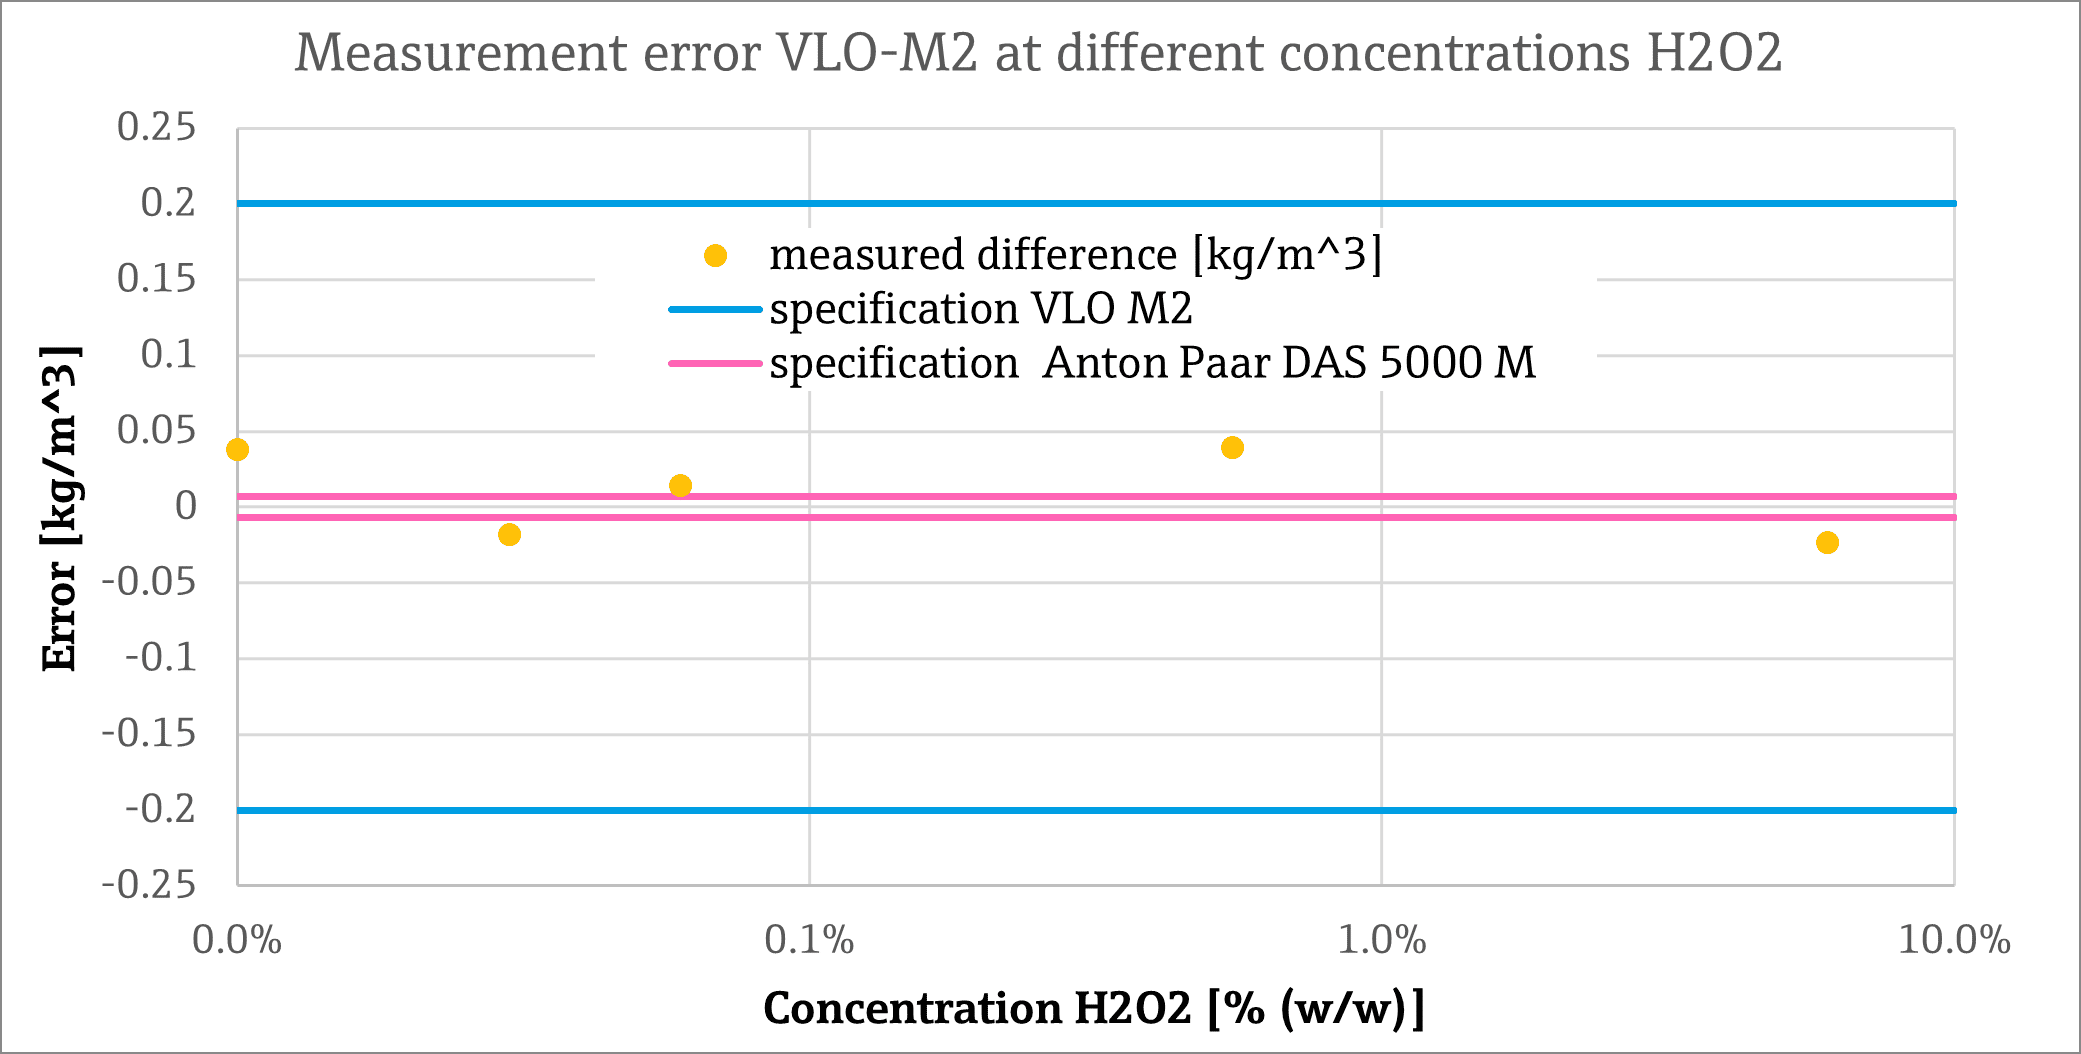
The difference between the laboratory unit and the VLO-M was2 <0.05 kg/m3over the entire concentration range. This is far below theVLO-M2’s specified measurement error of ± 0.2kg/m3 and closer to the specified measurement error of the laboratory instrument of ±0.007kg/m3, as can be seen quite clearly in the following graphic:
Converted to the density difference of 20.23 kg/m3 between the 6% stock solution and deionised water, the maximum measured deviation of ±0.04 kg/m3 corresponds to an uncertainty in the concentration of <0.025% (250ppm) or <0.0125% (125ppm). Although in reality, the dependence between concentration and density is not linear, this value provides a good indication.
Finally, the measured density difference between the measured hydrogen peroxide solutions and the theoretical value of pure water (according to REFPROP, NIST) is once again shown here graphically:
An almost identical offset to the reference value can be observed with both measuring methods, with pure deionised water and the lowest concentration of 0.03% H2O2. Possibleexplanations could include a rapid decay of H2O2 at very low concentrations or a weak influence of H2O2 on the density in this range. If the density were to increase in linear fashion, the laboratory instrument, at least, should be able to resolve the density difference between 0% and 0.03% without any problems, with the result that a measurement error would appear unlikely.
However, a clear increase in density is then observed with both instruments when the H2O2 concentration is doubled to 0.059% (note the logarithmic scales). Here, correspondence between the measurements is also excellent, which speaks for the measurement accuracy of the VLO-M2
The VLO-M2 and the laboratory instrument DSA 5000 M (Anton Paar) were used to measure the densitiesofa hydrogen peroxide stock solution of 6% as well asthe dilutions thereof,which consisted of 0.547%, 0.059%, 0.030% and 0% hydrogen peroxide in deionised water . Concentrations of <0.1% were volumetrically created and density to percentages by weight recalculated, and the higher concentration was weighed in directly. The measurements on the two devices took place simultaneously. The temperature on the laboratory unit was adjusted to the temperature in the VLO-M2 in order, to permit a direct comparison (25.2 – 25.7°C). The VLO-M2 does not have active temperature stabilisation like the laboratory measuring device, and so theavailable data was averaged in a temperature window of ±0.02°C and used accordingly.
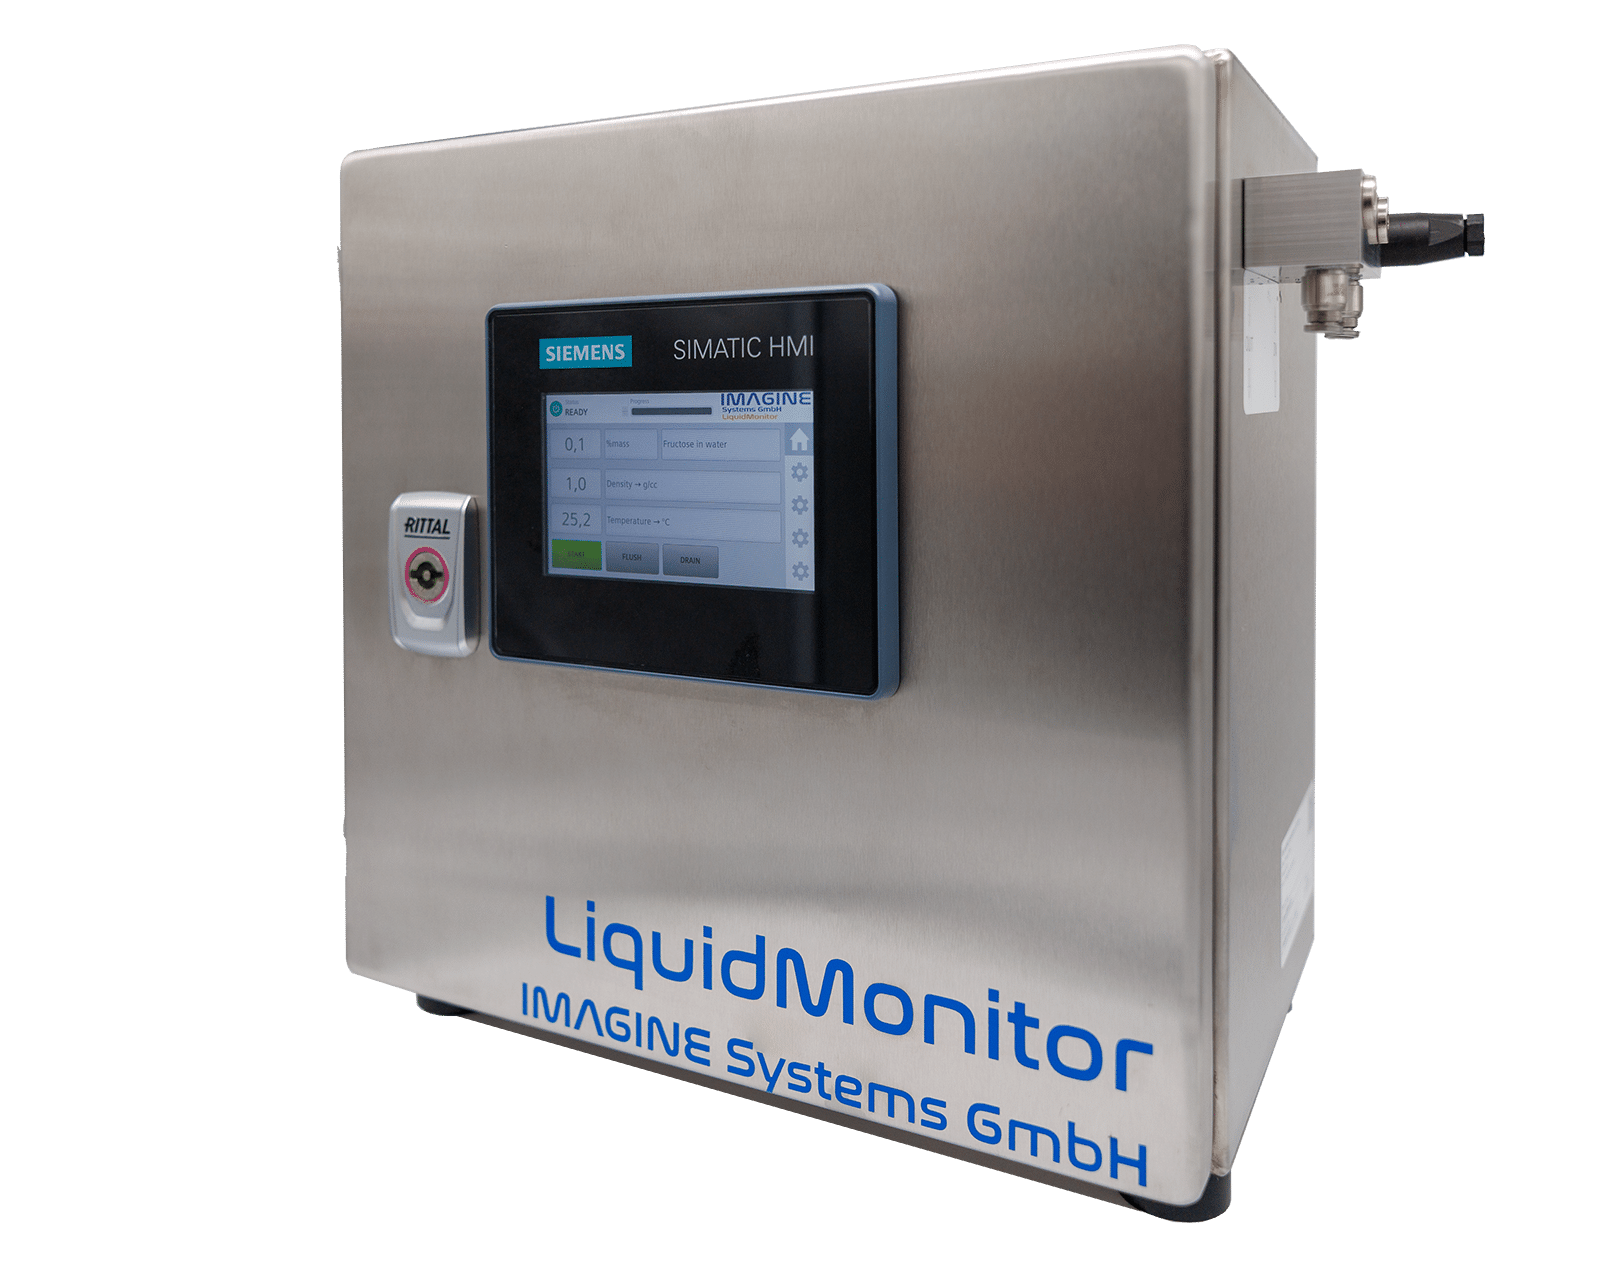
In close collaboration with Imagine Systems, a compact and intelligent analysis device was developed that combines high precision with ease of use. The integration of MEMS technology and smart sample control makes the system a powerful solution for real-time concentration and density measurement. The system features an integrated controller that enables automated sampling, pump control, and analysis functions. Samples can be conveniently drawn from any container—ideal for laboratory applications, process monitoring, or mobile use.
Summary
This test answers the question regarding the measurement accuracy of the VLO-M2 with aqueous hydrogen peroxide solutionsfrom 0% – 6% under ambient conditions: The measurement error was<0.05 kg/m3 when we performed our test.This is far below the specified ± 0.2kg/m3 for the VLO-M2. Sincethe specification at extreme temperatures, from -40°C to60°C and in the entire density ranges from 0 kg/m3 up to 1200 kg/m3must be compliedwith, the measurement error with aqueous solutions and temperatures close to room temperature can be many times smaller, as shown here. The measured errors (<0.025%) correspond approximately toan accuracy of 250ppm for the determination of the concentration of H2O2 in water which, in the case ofmany applications of this mixture, is more than sufficient.
Microfluidic devices are becoming increasingly important in various fields of pharmacy, flow chemistry and healthcare. In the embedded microchannel, the flow rates, the dynamic viscosity of the transported liquids and the fluid dynamic properties play an important role. Various functional auxiliary components of microfluidic devices such as flow restrictors, valves and flow meters need to be characterised with liquids used in several microfluidic applications.
Density and Concentration Measurement Applications for Novel MEMS-based Micro Densitometer for GasC. Huber, TrueDyne Sensors AG, Reinach BL (Switzerland), Endress+Hauser Flowtec, Reinach BL (Switzerland)Abstract A MEMS cantilever based resonant device for gas...
Design, Simulation, Fabrication and Characterization of piezoelectric MEMS Cantilever for Gas Density and Viscosity Sensors ApplicationsA. Mehdaoui¹, C. Huber¹, J. Becker¹, F. Schraner¹, L. Villanueva² ¹TrueDyne Sensors AG, Reinach BL (Switzerland), ²Ecole...
The aim of the study is to develop a compact, robust and maintenance free gas concentration and humidity monitoring system for industrial use in the field of inert process gases. Our multiparameter gas-monitoring system prototype allows the simultaneous measurement of the fluid physical properties (density, viscosity) and water vapor content (at ppm level) under varying process conditions.
MEMS technologyAt a glance In the previous section (part 2) we got to know the vibration measuring method. This section deals with the establishment of MEMS technology at TrueDyne Sensors AG. The technology has brought about the MEMS sensor, the heart of which is an...
The resonator density measurementAt a glance In the previous part (1) we learned about the basics of density measurement and the definition of density. This section is dedicated to the vibration method which is also used by density sensors for density measurement....
In-line measurements of the physical and thermodynamic properties of single and multicomponent liquids
Authors: Hugo Bissig, Oliver Büker, Emmelyn Graham, Leslie Wales, Andreia Furtado, Sara Moura, Zoe Metaxiotou, Seok Hwan Lee, Sabrina Kartmann, Jarno Groenesteijn and Joost C. Lötters
Abstract
Microfluidic devices are becoming increasingly important in various fields of pharmacy, flow chemistry and healthcare. In the embedded microchannel, the flow rates, the dynamic viscosity of the transported liquids and the fluid dynamic properties play an important role. Various functional auxiliary components of microfluidic devices such as flow restrictors, valves and flow meters need to be characterised with liquids used in several microfluidic applications. However, calibration with water does not always reflect the behaviour of the liquids used in the different applications. Therefore, several National Metrology Institutes (NMI) have developed micro-pipe viscometers for traceable inline measurement of the dynamic viscosity of liquids used in flow applications as part of the EMPIR 18HLT08 MeDDII project. These micro-pipe viscometers allow the calibration of any flow device at different flow rates and the calibration of the dynamic viscosity of the liquid or liquid mixture used under actual flow conditions. The validation of the micro-pipe viscometers has been performed either with traceable reference oils or with different liquids typically administered in hospitals, such as saline and/or glucose solutions or even glycerol-water mixtures for higher dynamic viscosities. Furthermore, measurement results of a commercially available device and a technology demonstrator for the inline measurement of dynamic viscosity and density are presented in this paper.
Wink of Knowledge: Thermal flow measurement and correction by means of gas detection
Why this test?
Calorimetric flow sensors are typically adjusted to a specific medium, as the measured value is influenced by the thermal conductivity and capacity of the gas. Thus, a specially calibrated sensor is required for each gas. In combination with a density measurement for clean gas detection or concentration determination of binary gas mixtures, calibration data and correction factors can be assigned flexibly and while the process is running. This means that the correct flow value is calculated at all times, regardless of the clean gas or mixing ratio of the mixture, and only one sensor solution is required for this measuring point.
What is a wink of knowledge?
Do you need to quickly measure, draw or do something? The speed to the result counts more than the perfect (scientific) approach. For this reason, we have introduced the wink of knowledge. Science with a wink, so to speak. We don’t want to prove anything scientifically, but quickly demonstrate something pragmatically. If you are interested, we would be happy to discuss these results in more detail with you and your project.
Results
In Figure 1, the raw flow values are plotted in blue on the right-hand axis and the corrected volume flow in orange on the left-hand axis. The blue linear fit clearly shows how the different thermal parameters of CO2 and N2 falsify the determined measured value without density or concentration correction. However, by adding an inline density measurement, the flow can be corrected to within approx. 2% of the set 100 sccm, as shown by the orange linear fit. It has thus been demonstrated that the combination of the TrueDyne density sensor DGF-I1 and the IST flow sensor SFS01 can accurately determine the flow velocity regardless of the concentration ratios of the binary gas mixture.
In addition to binary gas mixtures of known gas components, this principle can also be extended to switching between gases with different densities. Using a clean gas detection system, it is thus possible to select the appropriate calibration data or correction factors and correct the measured value in real time. This makes it possible to realise a flexible, price-performance-optimised flow measurement with all the advantages of the thermal measuring principle:
Long-term stable and vibration-resistant measurement
Compact design
Suitable for process control, thanks to particularly fast response times (<10 msec.)
High sensitivity from the lowest flow velocities including direction detection
Clean gas detection
Multi-parametric measuring system (flow, density, pressure, temperature)
Microleakage monitoring
Figure 1: Comparison between corrected and raw flow rate
Experimental setup
Figure 2 shows the setup of the experimental station. The desired flow rate value for various pure gases and gas mixtures was set using thermal mass flow controllers (MFC 1-5) connected in parallel. The mass flow controllers are each calibrated to the corresponding clean gas, which means that the mixing ratio can be precisely controlled. The gas mixture then flows through the two density and flow sensors connected in series.
The I2C measurement signal from the flow sensor is transmitted directly to the gas density sensor, which uses the measured density and the concentration derived from it to calculate the raw value with a correction factor. The resulting flow measured value can now be compared with the set target value of the gas mixers to verify the functionality of the prototype.
Click here to learn more about the flow sensor from IST AG.
Procedure
The density measurement, on which the clean gas detection and concentration determination is based, was carried out with the DGF-I1 density sensor for gases from TrueDyne. The gas flow and its direction were determined using the SFS01 Evalkit thermal flow sensor from Innovative Sensor Technology (IST AG).
Two external thermal mass flow controllers (MFC) were used to set several concentrations of a binary gas mixture of CO2 and N2 and to constantly flow through the sensors. Using the logging function, three readings per second were recorded for the following parameters: concentration, flow rate raw value and corrected flow rate.
Microfluidic devices are becoming increasingly important in various fields of pharmacy, flow chemistry and healthcare. In the embedded microchannel, the flow rates, the dynamic viscosity of the transported liquids and the fluid dynamic properties play an important role. Various functional auxiliary components of microfluidic devices such as flow restrictors, valves and flow meters need to be characterised with liquids used in several microfluidic applications.
Density and Concentration Measurement Applications for Novel MEMS-based Micro Densitometer for GasC. Huber, TrueDyne Sensors AG, Reinach BL (Switzerland), Endress+Hauser Flowtec, Reinach BL (Switzerland)Abstract A MEMS cantilever based resonant device for gas...
Design, Simulation, Fabrication and Characterization of piezoelectric MEMS Cantilever for Gas Density and Viscosity Sensors ApplicationsA. Mehdaoui¹, C. Huber¹, J. Becker¹, F. Schraner¹, L. Villanueva² ¹TrueDyne Sensors AG, Reinach BL (Switzerland), ²Ecole...
The aim of the study is to develop a compact, robust and maintenance free gas concentration and humidity monitoring system for industrial use in the field of inert process gases. Our multiparameter gas-monitoring system prototype allows the simultaneous measurement of the fluid physical properties (density, viscosity) and water vapor content (at ppm level) under varying process conditions.
MEMS technologyAt a glance In the previous section (part 2) we got to know the vibration measuring method. This section deals with the establishment of MEMS technology at TrueDyne Sensors AG. The technology has brought about the MEMS sensor, the heart of which is an...
The resonator density measurementAt a glance In the previous part (1) we learned about the basics of density measurement and the definition of density. This section is dedicated to the vibration method which is also used by density sensors for density measurement....
Wink of knowledge: Brine Water Concentration Measurement – DLO Density Sensor
Volume 2 | Number 2
Why this test?
When taking measurements in boreholes for the extraction of salt, the concentration measurement poses a fairly large problem. In the case of saturated brine, even slight changes in the process lead to salt deposits, which will cause every measuring device to fail in the short or long term. With this test we wanted to show that it is possible to measure the concentration of brine with our DLO.
What is a wink of knowledge?
Do you sometimes need to measure, draw or do something quickly? The speed at which you get to the result counts more than the perfect (scientific) approach. For this reason, we introduced a wink of knowledge. Science with a wink, so to speak. Our aim is not to prove anything scientifically, but to quickly demonstrate something pragmatically. If you’re interested, we would be happy to discuss these results in more detail with you and your project.
What liquids were used?
Brine water at various concentrations:
26% brine
15% brine
Density measurement
The density was measured with the DLO-M1 density sensor for liquids. For this purpose, the listed concentrations were passed through the sensor at a constant flow rate. Using the logging function, a reading for density and temperature was logged every second.
Brine (26.1%)
1197.109 kg/m³
at 20 °C, 1.01325 bar abs
Brine (15%)
1108.9 kg/m³
at 20 °C, 1.01325 bar abs
The TrueDyne sensor
The DLO-M2 density sensor measures the density of a fluid in a microelectromechanical system (MEMS system). Inside the sensor, the medium is passed via a pressure gradient to the so-called omega chip, which contains an omega-shaped microchannel. This vibronic measuring system generates the measured values by setting a silicon tube in the chip into resonant vibration and analysing this. This is because the quality of the vibration depends on the viscosity of the liquid in the microchannel. At the same time – and independent of the viscosity – the density of the medium can be determined via the frequency of the microchannel. Since temperature influences both viscosity and density, the temperature of the medium is also recorded in real time in the chip. This way, the temperature effect can be compensated.
DLO density sensor for liquids
The measuring system in the submillimetre range enables the compact construction of the sensor. It is only 80 x 30 x 15 mm³ small and thus fits inside even the tightest of spaces. The readings reach the higher-level system via an RS232 interface and in the ASCII command protocol in the TrueDyne Sensors standard.
Test setup
Determination of density at 20 °C with laboratory density meter DSA 5000 M (Anton Paar)
Insert the density sensor into the measurement setup as shown in the picture
Circulation system with pump set up for measuring brine concentration
Measurement setup
Starting materials: NaCi and water
Bottle: NaCi water at various concentrations
Peristaltic pump (Ismatec, ISM930C)
DLO density sensor
Data evaluation
Return of the medium
Figure 1 – Measurement setup
Results
After a short time, the saturated brine also caused drifts in our sensor (Figure 2). This is, of course, not a satisfactory solution for continuous measurement. Due to the small measuring volume in our sensor, we came up with the right idea: we dilute the brine with pure water and then calculate back to get the total volume. The flow rate is measured or controlled with our own Coriolis sensors for the smallest flow rates. With a reduction in salinity of <15%, the initial drifts could be eliminated, allowing continuous measurement (Figure 3).
Figure 2 – Measurement result NaCi 26%, measured over 3 hours (axes: Y = concentration / X = time)
Figure 3 – Measurement result NaCi 15%, measured over 3 hours (axes: Y = concentration / X = time)
How can this now be implemented in practice? If the flow rate of the fresh water supply and the total volume at the outlet are measured, the concentration can be determined very accurately using a linear function (Figure 4). Due to the lower salt content, drifts also no longer occur, which enables long-term measurement in the field. The slight deviation in Figure 4 is due to the measurement setup. This allowed water to evaporate over the long measurement period (which is why the proportion of NaCl in the concentration increases).
Figure 4 – Measurement result NaCi 15%, measured over 158 hours (axes: Y = concentration / X = time)
Microfluidic devices are becoming increasingly important in various fields of pharmacy, flow chemistry and healthcare. In the embedded microchannel, the flow rates, the dynamic viscosity of the transported liquids and the fluid dynamic properties play an important role. Various functional auxiliary components of microfluidic devices such as flow restrictors, valves and flow meters need to be characterised with liquids used in several microfluidic applications.
Density and Concentration Measurement Applications for Novel MEMS-based Micro Densitometer for GasC. Huber, TrueDyne Sensors AG, Reinach BL (Switzerland), Endress+Hauser Flowtec, Reinach BL (Switzerland)Abstract A MEMS cantilever based resonant device for gas...
Design, Simulation, Fabrication and Characterization of piezoelectric MEMS Cantilever for Gas Density and Viscosity Sensors ApplicationsA. Mehdaoui¹, C. Huber¹, J. Becker¹, F. Schraner¹, L. Villanueva² ¹TrueDyne Sensors AG, Reinach BL (Switzerland), ²Ecole...
The aim of the study is to develop a compact, robust and maintenance free gas concentration and humidity monitoring system for industrial use in the field of inert process gases. Our multiparameter gas-monitoring system prototype allows the simultaneous measurement of the fluid physical properties (density, viscosity) and water vapor content (at ppm level) under varying process conditions.
MEMS technologyAt a glance In the previous section (part 2) we got to know the vibration measuring method. This section deals with the establishment of MEMS technology at TrueDyne Sensors AG. The technology has brought about the MEMS sensor, the heart of which is an...
The resonator density measurementAt a glance In the previous part (1) we learned about the basics of density measurement and the definition of density. This section is dedicated to the vibration method which is also used by density sensors for density measurement....
Wink of knowledge: Ethylene Glycol-Water Mixture – VLO Density and Viscosity Meter for Liquids
Volume 2 | Number 1
Why this test?
The measurements carried out are intended to show, in a series of various quick tests, how the concentration of two liquids can be controlled in operation using the VLO density and viscosity sensor.
The present measurement results show the top performance of our small sensor.
What is a wink of knowledge?
Do you sometimes need to quickly measure, draw or tinker with something?
The speed with which you arrive at the result counts more than the perfect (scientific) approach.
For this reason, we’ve introduced a wink of knowledge.
Science with a wink, so to speak.
We don’t want to prove anything scientifically, but quickly demonstrate something pragmatically.
If you’re interested, we’d be happy to discuss these results in more detail with you and your project.
What liquids were used?
Ethylene glycol
Carl Roth (art. no.: 2441.4)
Deionised water
Density measurement
The density was measured using the VLO density and viscosity sensor for liquids.
For this purpose, the listed mixtures were passed through the sensor at a constant flow rate.
By means of the logging function, one measured value per second was recorded for density, temperature, pressure and reference density.
Ethylene glycol (C2H6O2)
1,113.37 kg/m³ 2
at 20 °C, 1.01325 bar abs
Water (H2O)
998.21 kg/m³
at 20 °C, 1.01325 bar abs
The TrueDyne sensor
The VLO-M2 viscosity sensor measures the viscosity of a liquid in a microelectromechanical system (MEMS system). The medium is guided in the sensor via a pressure gradient to the so-called omega chip, which contains an omega-shaped microchannel. This vibronic measuring system generates the measured values by setting a silicon tube in the chip into resonant vibration and analysing this. This is because the vibration quality depends on the viscosity of the liquid in the microchannel. At the same time – and independent of the viscosity – the density of the medium can be determined via the frequency of the microchannel. Since temperature influences both viscosity and density, the temperature of the medium is also recorded in the chip in real time. In this way, the temperature effect can be compensated for.
The measuring system in the submillimetre range enables the compact construction of the sensor. Measuring just 80 x 30 x 15 mm (36,000 mm³), there is room for it in even the tightest of spaces. The measured values reach the higher-level system via an RS232 interface and in the ASCII command protocol in the TrueDyne Sensors standard.
VLO density and viscosity sensor for liquids
Procedure
Purification of ethylene glycol and determination of purity through density measurement with a laboratory density meter DSA 5000 M (Anton Paar)
Mixing of water on a laboratory scale (Kern, PCB 1000-2) to produce different target concentrations (w/w) as a reference.
Inserting the viscosity sensor into the measurement setup according to the sketch
Pumping the ethylene glycol-water mixture through the viscosity sensor
Measurement setup
Ethylene glycol / water mixture
Peristaltic pump (Ismatec, ISM930C)
Temperature basin (Julabo, F 34)
VLO density and viscosity sensor
Evaluation calculator
Hose (media supply)
Hose (media removal)
Figure 1 – Measurement setup
Results
The following table shows the measured values obtained for ethylene glycol concentrations of between 0 and 60%.
Table 1 – Measured values for concentrations of between 0 and 60%
In the following graph, the measurement deviation is plotted against the reference ethylene glycol concentration.
Over the entire measuring range (0 to 60% ethylene glycol), the maximum concentration deviation is less than 0.4%.
In addition to the direct output of the ethylene glycol concentration, other applications are conceivable, such as the direct output of the freezing point of the ethylene glycol-water mixture.
Figure 2 – Measurement deviation in the tested measurement range between 0 and 60%
Microfluidic devices are becoming increasingly important in various fields of pharmacy, flow chemistry and healthcare. In the embedded microchannel, the flow rates, the dynamic viscosity of the transported liquids and the fluid dynamic properties play an important role. Various functional auxiliary components of microfluidic devices such as flow restrictors, valves and flow meters need to be characterised with liquids used in several microfluidic applications.
Density and Concentration Measurement Applications for Novel MEMS-based Micro Densitometer for GasC. Huber, TrueDyne Sensors AG, Reinach BL (Switzerland), Endress+Hauser Flowtec, Reinach BL (Switzerland)Abstract A MEMS cantilever based resonant device for gas...
Design, Simulation, Fabrication and Characterization of piezoelectric MEMS Cantilever for Gas Density and Viscosity Sensors ApplicationsA. Mehdaoui¹, C. Huber¹, J. Becker¹, F. Schraner¹, L. Villanueva² ¹TrueDyne Sensors AG, Reinach BL (Switzerland), ²Ecole...
The aim of the study is to develop a compact, robust and maintenance free gas concentration and humidity monitoring system for industrial use in the field of inert process gases. Our multiparameter gas-monitoring system prototype allows the simultaneous measurement of the fluid physical properties (density, viscosity) and water vapor content (at ppm level) under varying process conditions.
MEMS technologyAt a glance In the previous section (part 2) we got to know the vibration measuring method. This section deals with the establishment of MEMS technology at TrueDyne Sensors AG. The technology has brought about the MEMS sensor, the heart of which is an...
The resonator density measurementAt a glance In the previous part (1) we learned about the basics of density measurement and the definition of density. This section is dedicated to the vibration method which is also used by density sensors for density measurement....
Wink of knowledge: Air & N2 – DGF-I1 density sensor for gases
Year 1 | Number 1
Why this test?
The measurements performed in a series of various quick tests are intended to demonstrate how precisely the DGF-I1 density sensor for gases works in operation.
Since air and nitrogen have a similar density range, the test results confirm our expectations for the DGF-I1 density sensor.
What is a wink of knowledge?
Do you sometimes need to measure, draw or make something quickly?
And the speed at which you get to the result counts more than the perfect (scientific) approach?
For this reason, we have introduced a wink of knowledge.
Science with a twinkle in its eye, so to speak.
We’re not looking to prove something scientifically, but rather to quickly demonstrate something pragmatically. If you’re interested, we would be happy to discuss these results in more detail with you and your project.
Which gases were used?
Nitrogen 4.5
PanGas (material number 6430112)
Dry air
Air compressor
Density measurement
The density was measured with the gas density sensor DGF-I1.
For this purpose, the listed gases were passed through the sensor for a period of time at a constant flow rate.
A logging function was used to record a reading for the density, temperature, pressure and reference density once every second.
Nitrogen (N2)
1.2503 kg/m³
at 0 °C, 1.01325 bar abs
Dry air (Air)
1.292 kg/m³
at 0 °C, 1.01325 bar abs
The TrueDyne sensor
With a diameter of 33.5 mm and a length of 63 mm, the DGF-I1 density sensor has a very compact design and fits into the smallest of spaces.
It is screwed directly into the gas pipe or gas tank with the integrated connection; a filter protects against contamination.
The readings are transmitted to the higher-level system via an RS485 interface.
The response time of 5 seconds makes a density measurement directly in the process possible – the measurement does not have to be interrupted.
Media which differ from the media listed above can be used after individual clarification, if necessary.
For example Neon (Ne) and Krypton (Kr).
DGF-I1 density sensor for gases
Max.
deviation:
Density: <0.1 kg/m³
Temperature: <0.8 °C
Pressure: <0.04 bar
With field adjustment density <0.05 kg/m³
Repeatability:
Density: <0.015 kg/m³
Temperature: <0.06 °C
Pressure: <0.005 bar
Permissible density measuring range:
0.2 … 19 kg/m³
Permissible pressure range:
Max.
measurement range:
1…10 bar (absolute)
Gas mixtures with argon (Ar) only up to
max. 9 bar (abs) must be used.
Burst pressure 30 bar
Test setup
Figure 1 shows the structure of the test station.
Five thermal mass flow controllers (MFC) connected in parallel allowed the various pure gases to flow through the sensor in alternation.
The installation of the exhaust at the side opening of the sensor favours the gas exchange in the housing, which optimises the reaction time.
Gas supply
MFC: Vögtlin red-y GSC-B9SA-BB23
Static mixer: Swagelok
Density sensor: TrueDyne DGF-I1
Figure 1 – Design of gas mixer
Results
In order to better assess the results of the measurements, the mean values of density, pressure, temperature, and reference density (at T = 0 °C, p = 1.01325 bar abs) were calculated.
For this purpose 100 measuring points per medium were used in the steady state.
Figure 2 shows the reaction time and stability of the measured values as well as the reference density output by DGF-I1 and the calculated reference density at 0 °C under atmospheric pressure of 1.01325 bar abs.
Reference density Air – dry air
Reference density N2 – nitrogen
A. Data extract table A
B. Data extract Table B
The maximum deviation of the DGF-I1 (density: <0.1 kg/m³) is clearly outside the scale of Figure 2
Table 1 – Calculation of mean values and reference density
Figure 2 – Measurement results for air and N2
Figures 3 and 4 show the frequency distributions of the measured reference densities and help to visualise the repeatability of the gas density sensor.
The same readings were used as for the mean value calculations; the class width was defined as 0.001 kg/m³ for both media.
Figure 3 – Distribution of reference density – Air dry air
Figure 4 – Distribution of reference density – N2 nitrogen
The fields A and B marked in Figure 2 show the origin of the raw data of tables A (second 5…15) and table B (second 160…170).
Table A – Measurement results air and N2 – second 5..15
Table B – Measurement results air and N2 – second 160..170
Microfluidic devices are becoming increasingly important in various fields of pharmacy, flow chemistry and healthcare. In the embedded microchannel, the flow rates, the dynamic viscosity of the transported liquids and the fluid dynamic properties play an important role. Various functional auxiliary components of microfluidic devices such as flow restrictors, valves and flow meters need to be characterised with liquids used in several microfluidic applications.
Density and Concentration Measurement Applications for Novel MEMS-based Micro Densitometer for GasC. Huber, TrueDyne Sensors AG, Reinach BL (Switzerland), Endress+Hauser Flowtec, Reinach BL (Switzerland)Abstract A MEMS cantilever based resonant device for gas...
Design, Simulation, Fabrication and Characterization of piezoelectric MEMS Cantilever for Gas Density and Viscosity Sensors ApplicationsA. Mehdaoui¹, C. Huber¹, J. Becker¹, F. Schraner¹, L. Villanueva² ¹TrueDyne Sensors AG, Reinach BL (Switzerland), ²Ecole...
The aim of the study is to develop a compact, robust and maintenance free gas concentration and humidity monitoring system for industrial use in the field of inert process gases. Our multiparameter gas-monitoring system prototype allows the simultaneous measurement of the fluid physical properties (density, viscosity) and water vapor content (at ppm level) under varying process conditions.
MEMS technologyAt a glance In the previous section (part 2) we got to know the vibration measuring method. This section deals with the establishment of MEMS technology at TrueDyne Sensors AG. The technology has brought about the MEMS sensor, the heart of which is an...
The resonator density measurementAt a glance In the previous part (1) we learned about the basics of density measurement and the definition of density. This section is dedicated to the vibration method which is also used by density sensors for density measurement....
A MEMS cantilever based resonant device for gas monitoring actuated and sensed piezoelectrically, has been designed, simulated, fabricated and tested. Aluminum Nitride (AlN) has been used as active material to implement the piezoelectric actuator and sensor. Simulation performed using COMSOL and measurements show a very good agreement. The final system, the full sensor for gas monitoring, allows the measurement of gas density and viscosity at temperatures between 0 and 60 °C and pres-sures between 1 and 10 bar abs. with accuracies of <0.03 kg/m3 and 6% respectively. A second tech-nological run that aims to improve the viscosity accuracy is ongoing.
A close cooperation for reliable measurement results of density sensors
Over the last few years, TrueDyne Sensors AG has acquired a great deal of expertise and know-how in the field of micro sensor technology and vibrating systems. The density module from TrueDyne Sensors AG is a flexural resonator measuring system in the MEMS technology with a measuring channel in sub-millimeter size. Measuring systems like these enable numerous companies to expand and improve their products and production sequences within the process. The high accuracy, the extremely compact design and the real-time measurement play a central role in these density modules.
No Results Found
The page you requested could not be found. Try refining your search, or use the navigation above to locate the post.
No Results Found
The page you requested could not be found. Try refining your search, or use the navigation above to locate the post.
Design, Simulation, Fabrication and Characterization of piezoelectric MEMS Cantilever for Gas Density and Viscosity Sensors Applications
A. Mehdaoui¹, C. Huber¹, J. Becker¹, F. Schraner¹, L. Villanueva² ¹TrueDyne Sensors AG, Reinach BL (Switzerland), ²Ecole Polytechnique Fédérale de Lausanne, Lausanne (Switzerland)
Abstract
This paper explores applications of recently released MEMS (Micro Electro Mechanical System) – based process densitometer for gas. The core of the sensor is a resonating silicon microtube which is flowed through by the process gas. Due to the very low density of silicon and the fact that the tube is resonating in a vacuum cavity very good density sensitivity is achieved even for low fluid densities. The sensor therefore perfectly suits gas density applications with a medium pressure between 5 and 20 bar. The microfluidic sensor has density and temperature measurement capabilities. Additionally pressure is monitored along the fluidic path. From these measured physical properties, real time quality information of the measured gas such as molar mass, reference density, specific gravity, gas composition and calorific value can be derived. Process applications are demonstrated with experimental and theoretical results.
Event
SMSI 2020
(did not take place because of Covid-19 virus pandemic)
A close cooperation for reliable measurement results of density sensors
Over the last few years, TrueDyne Sensors AG has acquired a great deal of expertise and know-how in the field of micro sensor technology and vibrating systems. The density module from TrueDyne Sensors AG is a flexural resonator measuring system in the MEMS technology with a measuring channel in sub-millimeter size. Measuring systems like these enable numerous companies to expand and improve their products and production sequences within the process. The high accuracy, the extremely compact design and the real-time measurement play a central role in these density modules.
No Results Found
The page you requested could not be found. Try refining your search, or use the navigation above to locate the post.
No Results Found
The page you requested could not be found. Try refining your search, or use the navigation above to locate the post.
A Multiparameter Gas-Monitoring System Combining Functionalized and Non-Functionalized Microcantilevers
C. Huber¹, A. Mehdaoui¹, M. P. P. Pina² ³, J.J. Morales²,
¹TrueDyne Sensors AG, 4153 Reinach BL, Switzerland, ²Nanoscience Institute of Aragon (INA), University of Zaragoza, 50009 Zaragoza, Spain, ³Instituto de Ciencia de Materiales de Aragon (ICMA), Universidad de Zaragoza-CSIC, 50009 Zaragoza, Spain
Abstract
Ziel der Arbeit ist es, ein kompaktes, robustes und wartungsfreies Gaskonzentrations- und Feuchteüberwachungssystem für den industriellen Einsatz im Bereich der inerten Prozessgase zu entwickeln. Unser Prototyp eines Multiparameter-Gasüberwachungssystems ermöglicht die gleichzeitige Messung der thermophysikalischen Eigenschaften (Dichte, Viskosität) sowie des Wasserdampfgehalts (im ppm-Bereich) unter verschiedenen Prozessbedingungen. Dieser Ansatz wird durch die Kombination von funktionalisierten und nicht funktionalisierten Mikro-Cantilevern in einer einzigen Messplattform ermöglicht. Die Genauigkeit der Dichte- und Viskositätsmessung mit nicht funktionalisierten Mikro-Cantilevern wird für verschiedenen Gase über einen breiten Temperatur- und Druck- Bereich ausgewertet. Für die Feuchtemessung werden mikroporöses Y-Typ-Zeolith und mesoporöses Siliciumdioxid MCM48 als Sensormaterialien verwendet und charakterisiert. Eine leicht skalierbare Funktionalisierungsmethode für die Produktion mit hohem Durchsatz wird dabei angestrebt. Experimentelle Ergebnisse mit funktionalisierten Mikro-Cantilevern, die Wasserdampf (im ppm-Bereich) ausgesetzt sind, zeigen, dass Frequenzveränderungen nicht allein auf einen Masseneffekt zurückzuführen sind, sondern dass auch Steifigkeitseffekte in Abhängigkeit von der Wasser-Adsorption und der Temperatur berücksichtigt werden müssen. Um diese Hypothese zu stützen, wurde die mechanische Reaktion solcher Mikro-Cantilever modelliert, wobei sowohl die Effekte als auch die simulierten Ergebnisse durch Vergleich mit experimentellen Daten validiert wurden.
A close cooperation for reliable measurement results of density sensors
Over the last few years, TrueDyne Sensors AG has acquired a great deal of expertise and know-how in the field of micro sensor technology and vibrating systems. The density module from TrueDyne Sensors AG is a flexural resonator measuring system in the MEMS technology with a measuring channel in sub-millimeter size. Measuring systems like these enable numerous companies to expand and improve their products and production sequences within the process. The high accuracy, the extremely compact design and the real-time measurement play a central role in these density modules.
No Results Found
The page you requested could not be found. Try refining your search, or use the navigation above to locate the post.
No Results Found
The page you requested could not be found. Try refining your search, or use the navigation above to locate the post.
At a glance
In the previous section (part 2) we got to know the vibration measuring method. This section deals with the establishment of MEMS technology at TrueDyne Sensors AG. The technology has brought about the MEMS sensor, the heart of which is an oscillating silicon measuring channel. Compared to conventional resonator technology, it combines numerous advantages. These range from its small size and a wide range of applications to the exact determination of the density of gases, even at low pressure, and an extremely fast reaction time.
At a glance
In the previous part (1) we learned about the basics of density measurement and the definition of density. This section is dedicated to the vibration method which is also used by density sensors for density measurement. This method also has some advantages and disadvantages, which are explained in detail.
At a glance
This section gives you a first insight into the basics of density measurement. You will learn that density is a temperature and pressure-dependent substance property which is often specified with the unit kg/m3 or lb/ft3. The density value is required for determining concentration, average molecular weight and content. For finding the density of gases, it must be noted that this density depends on the respective pressure. The density of liquids depends on the temperature.
The DIN EN ISO 9001:2015 standard is an international standard that demonstrates high levels of quality to customers and third parties.
It serves as a catalogue of requirements for a quality management system.
The results are optimised internal company processes, minimised rejects, resource conservation, and increased customer and employee satisfaction.
An independent certification body confirms compliance with these standards.
The aim of the standard is to understand and implement the requirements that interested parties expect the company to meet.
The seven principles of quality management
The ISO 9000 standard explains the seven principles of quality management. They form the basis of quality management and are an important part of applying ISO 9001:2015 appropriately. They are:
Customer focus
Leadership
Engagement of people
Process approach
Continuous improvement
Evidence-based decision-making
Relationship management
Based on this, we apply practices such as risk-based thinking, a process approach and the PDCA cycle throughout our entire quality management system.
The PDCA cycle
The PDCA cycle is a model for sustainably optimising the quality management system in companies. It is a four-step method:
Plan – Determine improvement goals and define necessary measures
Do – Implement measures from the planning phase, document results
Check – Evaluate collected data to make an objective assessment of whether targets have been achieved
Act – Reflect on process and integrate effective improvement measures
This cycle helps to solve problems efficiently and offers several other advantages, such as enabling companies to prevent recurring errors and continuously improve work processes.
Corporate policy of TrueDyne Sensors AG
TrueDyne Sensors AG supports the decision of Endress+Hauser Flowtec AG not to formulate a fully integrated management policy. In our opinion, this enables clearer, more targeted formulations and statements, facilitates understanding for employees and customers, allows for faster and more flexible changes and, from our point of view, offers no disadvantages whatsoever.
Quality = customer satisfaction
We want satisfied and loyal customers
This is why we define quality as customer satisfaction and focus on generating outstanding customer benefits. Through satisfaction, we want to achieve customer loyalty and lasting relationships. All of our planning and actions must be geared to this. Everything we do must also be viewed from the customer’s perspective and must always be based on this key question: “Is what we are doing or planning to do useful and beneficial for our customers, or are we merely concentrating on our company’s growth?” Customer orientation is an essential part of our corporate identity.
We strive for zero defects in products and services
This is an indispensable prerequisite for customer satisfaction and loyalty. Every mistake affects our customers, disrupts their normal processes, and can have serious and perhaps even unforeseeable consequences. Every mistake costs our customers time and money, causes problems, and ultimately dissatisfaction. Over time, dissatisfied customers become disloyal and prefer to obtain their services and products elsewhere. Every customer that we lose weakens our company and strengthens our competitors. It is extremely difficult to win them back. Zero defects can only be achieved if the entire product life cycle is designed and aligned accordingly – from market analysis and product definition to development, production, sales, and shipping. This means that every employee must contribute to the overall effort.
We strive for Operational Excellence
In our company, we apply the LEAN principles to strengthen our focus on operational excellence and thus optimize the quality and flexibility of our products as well as our business processes. As a result, we systematically identify and eliminate activities and processes that do not generate added value through continuous improvement. Our fundamental approach is based on the Kaizen Continuous Improvement Process and we do everything we can to transmit this LEAN culture to our main suppliers.
We create products and services that we can be proud of
We develop, produce, and sell products and services that offer outstanding customer benefits and contribute significantly to improving customer loyalty thanks to their zero-defect quality. That is why we are proud of what we do. This also means that products and services are only provided or supplied to customers if we are convinced that they deliver the required and promised customer benefits, if they function perfectly, and are fault-free.
We want to promote a positive error culture that sees errors as an opportunity for improvement.
Everyone makes mistakes, but it is essential to correct them and learn from them. In our culture, no one is blamed or reprimanded for an error; but mistakes must not be repeated and, most importantly, must not be covered up! On the contrary, all of our employees are responsible for exposing and eliminating mistakes. Potential errors and possible sources of error are searched for, identified, and prevented using appropriate procedures and systems.
If an error leads to a customer complaint, our highest priority is to restore customer satisfaction. Like errors, complaints also provide an opportunity for improving our products and our understanding of customers. If, despite our best efforts, we are unable to restore our customer’s trust, we must use this lesson learned to discover and recognize the causes, and improve our future approaches.
We are reliable
We do what we say we are going to do. This applies both within our company and all the more so when dealing with our customers. All of our employees work closely together and we transfer unequivocal expertise at the right time. We provide accurate information in a responsible and timely manner. This is particularly important when working with our customers.
I am responsible for quality and continuous improvement.
I – and not just the others – am responsible for quality, continuous improvement, and customer satisfaction. As a company, we must constantly improve ourselves, our procedures, and our management system – and I play a key role in this process. What is good today may not be good enough tomorrow. In order to keep satisfied and loyal customers in the long term, we cannot rest on our laurels. That is why CIP, the continuous improvement process, plays a crucial role in our understanding of quality, determines our daily actions, and ensures our progress.
Dr. phil. nat. Christof Huber, Chief Technologist, TrueDyne Sensors AG @ the 4th conference on microfluidic handling systems – MFHS Enschede – October 2019
MULTIPARAMETR GAS MONITORING SYSTEM COMBINING A FUNCTIONALIZED AND A NON-FUNCTIONALIZED Microcantilever
C. Huber¹, A. Mehdaoui¹, M. P. P. Pina², J.J. Morales²,
¹TrueDyne Sensors AG, Reinach BL, Switzerland, ²University of Zaragoza, Nanoscience Institute of Aragon, Zaragoza, Spain
ABSTRACT
We present a novel online gas monitoring system combining a pressure and a temperature sensor with two resonating microcantilevers from which one is functionalized with a highly sensitive hydrophilic material. By simultaneously observing eigen-frequencies and quality factors of the cantilevers gas density and viscosity can be determined as well as gas humidity in a sub-permille range. With this sensor information we can deduce molar concentrations of binary or even ternary gas mixtures in % together with the gas vapor ratio in a low ppm range.
Introduction
The aim of the presented sensor project is to develop a compact, robust and maintenance free gas monitoring system for industrial use in the field of inert gases e.g. welding or modified atmospheric packaging gas mixing application. In such applications typically binary or ternary mixtures of argon, helium, nitrogen, carbon dioxide, oxygen or hydrogen are used. Gas concentrations must be controlled with accuracies in the % range. In most cases, the humidity must also be monitored in these applications. Typical limit values are between 200 and 40 ppm [1]. The state of the art is the use of several different sensors in a sequence, e.g. thermal conductivity, together with specific optical absorption and dew point sensors. Such installations are bulky and require frequent recalibration. To bring the same functionality in one multiparameter sensor system we combine two resonating microcantilevers together with pressure and temperature sensors on one PCB board that is exposed to the process gas.
Commercially available silicon microcantilevers initially designated for atomic force microscopy are used (see Fig. 1). One cantilever is used to measure the density and the viscosity of the gas as reported by Badarlis et al. [2] or Huber et al. [3] and the other to measure water vapor in low concentration by adding a functionalized hydrophilic surface layer as reported for example by Urbiztondo et al [4].
Figure 1: Sensor PCB with the a first microcantilever in front of a permanent magnet. The second cantilever is placed on the backside of the PCB. Actuation occurs by sending a small AC current over the metal coil on the cantilever tip.
Download Paper
MFHS Enschede
(Link)
REFERENCES
[1] ISO 14175:2008, “Welding consumables — Gases and gas mixtures for fusion welding and allied processes”
[2] A. Badarlis, A. Pfau, A. Kalfas., “Measurement and Evaluation of the Gas Density and Viscosity of Pure Gases and Mixtures Using a Micro-Cantilever Beam”, Sensors, 15(9), pp. 24318-24342, 2015
[3] C. Huber, P. Reith, A. Badarlis, “Gas Density and Viscosity Measurement with a Micro-cantilever for Online Combustion Gas Monitoring”, 19.GMA/ITG-Fachtagung Sensoren und Messsysteme, Nürnberg Germany, 2018
[4] M. A. Urbiztondo, A. Peralta, I. Pellejero, J. Sesé, M.P. Pina, I. Dufour, J. Santamaría, “Detection of organic vapours with Si cantilevers coated with inorganic (zeolites) or organic (polymer) layers”, Sens. Actuators B, Chem., v. 171–172, pp. 822–831, 2012.
The density of a liquid depends on its composition. If different liquids are mixed, the correct mixing ratio can be checked with density measurements. For example, in the case of heating oil: according to legal requirements, 7 % biodiesel may be added to heating oil. As this is tax-free, it is often operated at the limit of legality. With the density sensor DLO-M1 from TrueDyne, they monitor the quality of the fuel oil during the running process.
1. tank truck for the supply of fuel oil. 2 The sensor measures the density of the fuel oil directly at the transfer point. The data collected on site shows whether the correct media are being refueled in the correct ratio. 3 The product is handed over to the customer. Good quality is guaranteed.
Sensors for this application
Density sensor DLO-M1 for liquids
The DLO-M1 sensor measures the density of liquids in a microelectromechanical system (MEMS system). Within the MEMS system, the liquid is directed to an omega-shaped microchannel, the so-called omega chip. This tiny silicon tube – it is hardly thicker than a hair – is vibrated for the measurement. The density of the medium to be measured can be derived from the natural frequency of this oscillation.
Viscosity data can be used to determine the properties of liquids and monitor their quality. The sensor measures the viscosity in the running process – even in the smallest of spaces. Irrespective of the viscosity, the sensor also measures the density and temperature of the medium being measured.
Mark Twain is said to have said: “Writing is easy. You just have to leave out the wrong words.” In our case it is a complete sentence that we can omit from the VLO-M1 viscosity and density sensor data sheet.
Until that was the case, we needed a lot of developer sweat, brain and endurance.
Now the time has come, and we can delete the following sentence from the data sheet in the chapter “Permissible media”:
– Do not use aqueous media. –
With the current VLO-M1 viscosity and density sensors and the DLO-M1 density sensor, you can now also measure aqueous media.
We are looking forward to many new applications. Do you already have an idea? Get in touch with us – info@truedyne.com
Manufacturer & service provider:
Exchange of experience in density
measurement technology
«„Our measuring systems systems meet the highest standards of accuracy. With our partner and calibration expert, Testo lndustrial Services GmbH, we can continuously test and prove this quality requirement.
The measure ment results also help us to standardize our products for future calibration processes.“
»
Josua Ritter
Managing Director,TrueDyne Sensors AG
A close cooperation for reliable measurement results of density sensors
Over the last few years, TrueDyne Sensors AG has acquired a great deal of expertise and know-how in the field of micro sensor technology and vibrating systems. The density module from TrueDyne Sensors AG is a flexural resonator measuring system in the MEMS technology with a measuring channel in sub-millimeter size. Measuring systems like these enable numerous companies to expand and improve their products and production sequences within the process. The high accuracy, the extremely compact design and the real-time measurement play a central role in these density modules.
Testo lndustrial Services GmbH support the manufacturer of density sensors in ensuring these quality criteria. Because detailed measurements in an independent calibration laboratory ensure safety for the customer. The two companies – manufacturer and service provider, specialized in the field of flow, introduced a close cooperation project in 2018.
The goal – Cooperation
Testo & TrueDyne
The goal of the cooperation project was to have the DLO-M1 density sensor from TrueDyne Sensors AG verified, under laboratory conditions, by a manufacturer-independent calibration service provider. Above all, the main issue was to test the sensor‘s „suitability for everyday use“. This serves as the basis for recommending the density sensor to users of calibration systems.
Services provided by Testo Industrial Services GmbH
Provision of laboratory space and calibration test benches
Many years of know-how in the field of calibration technology
Definition of test procedures and measurement methods
Derivation of argumentation approaches based on the results
The procedure – Performance
of density measurements
Equipment used for the measurements:
Liquid calibration stand – Testo KKF80 MU ± 0.08 % F.S.
Temperature sensor 1/10 DIN
Pressure sensor ± 0.04 % F.S.
DLO-M1 density sensor – TrueDyne Sensors AG
VDI Heat Atlas 10th edition 2006, Dba14 Table 12. Kinematic viscosity of water
Density table according to NIST
The challenges
Factors to consider during density measurements
Measurement errors due to the smallest of temperature differences
Consideration of reference systems, e.g. density table for water, mineral content, compressibility of the medium
Reproducibility of the measurements for the comparison of measurement results
The result
Long-term use of measurement results
The cooperation project resulted in the successful verification of the DLO-M1 density sensor by the manufacturer-independent calibration laboratory Testo Industrial Services GmbH.
The following results can be derived:
The measurement results were very convincing. The density deviation was well clearly below ± 0.2 kg/m3, which leads to a measurement uncertainty of < 0.02 % of the measured value.
The measured values could be tested in a reproducible manner at various pressure levels.
The suitability of the DLO-M1 density sensor from TrueDyne Sensors AG is ensured for calibration systems.
Liquid calibrator for small flow rates of 0.8 ml/min – 40 l/min
Testo Industrial Services GmbH
Calibration service provider for more than 300 accredited calibration procedures
Testo Industrial Services GmbH is one of the leading calibration service providers in Germany. The calibration laboratory for flow meters performs manufacturer- and media-independent calibrations for liquids and gases. As the field of calibration is extremely diverse, a wide range of test benches and calibrators are required. Testo uses self-developed test benches. These enable the calibration of different flow rates with very low measurement uncertainties.
TrueDyne Sensors AG
Manufacturer of density and viscosity sensors in sub-millimeter sizes
TrueDyne Sensors AG is a subsidiary of Endress+Hauser. With the company foundation in 2015, the main focus of competence was set on the development of smallest sensor technology. The heart of the technology is the OMEGA-chip, whose function is based on the flexural resonator measuring principle. The chip in the MEMS technology consists of a measuring channel in sub millimeter size and an integrated platinum temperature sensor for real-time on-board temperature measurement.
The measuring channel is hardly thicker than a hair and thus opens up new prospects for density measurement technology directly in the process.
We made it! – German Innovation Awards Winner 2019
The German Innovation Awards honour products and solutions across sectors, which differ from previous solutions mainly by being user-centred and offering added value. They do so because there are innovations in all sectors that shape the future and improve life. Sometimes you see them at first glance – but often not. The German Innovation Awards aim to change that. They make great achievements visible to a wide audience and ensure successful positioning in the market.
We are proud to have won the German Innovation Award with our newly developed gas density sensor DGF-I1.
The gas density sensor DGF-I1 of TrueDyne Sensors AG combines smallest sensor Technology (MEMS = Micro Electro Mechanical Systems), physical models and highest calibration competence on smallest size. With our sensor, we redefine the state of the art and offer our customers added value in places where measurement has not been possible until today, e.g. in quality monitoring for food packaging. Our measuring system is based on a micro tuning fork, which is set into vibration. The resulting resonance frequency of the tuning fork depends on the density of the surrounding medium. Due to the possibilities of MEMS technology and the sensor technology based on it, the quality
Measure the density of a gas directly in the gas line or in the gas tank: This is made possible by the DGF-I1 density sensor from TrueDyne. At the heart of the sensor is a microelectromechanical system (MEMS) with an oscillator in the form of a tuning fork. For the measurement, the metal housing surrounding the MEMS is filled with the medium. The natural frequency of the oscillator varies depending on the density of the gas surrounding it. In order to compensate for temperature effects, a platinum resistor which precisely measures the local temperature is built into the sensor.
The sensor is very compact with a diameter of 31 mm and a length of 63 mm and can be placed in even the smallest of spaces. It is screwed directly into the gas line or the gas tank with the integrated connection, and a filter protects against contamination. The measured values are transmitted to the higher-level system via an RS485 interface. The response time of 5 seconds enables density measurement directly in the process – the measurement does not have to be interrupted.
Yes! We are among the finalists, top 3 in the Innovation Leaders category
at this year’s Swiss Technology Award.
On November 22, Switzerland’s most important technology prize will be awarded
for the 30th time as part of the Swiss Innovation Forum.
The Innovation Leaders category recognizes companies that bring to market
products / technologies that deliver clear, improved performance.
We are extremely pleased that, as a young company, we made it into the top three
in this category. Now we have to keep our fingers crossed for November 22, 2018
when the winner will be announced.
As an expert in density, we not only want to support you in finding an optimal product solution, but also be your first point of contact in this area. We are happy to share our density know-how in the form of a basic training course, which we have put together for you.
Monitoring the composition of your welding gas mixture leads to better controlled processes, saves money, and ensures quality. With this in mind, TrueDyne Sensors AG and HTK Hamburg developed a monitoring solution with latest data integration technology.
Are you interested to know more about it? Do not hesitate to contact us!
Reference: Endress+Hauser Flowtec AG (leading manufacturer of measurement instruments and solutions for process Automation)
Patrick Reith, R&D Project Manager MEMS of TrueDyne Sensors AG and Dr. Jana Knall, Product Manager Coriolis of Endress+Hauser had a talk about “Resonant Sensors about monitoring the quality of biogas” at the Congress Biogas on Wednesday, 31st January 2018.
Are you interested to know more about it?
The congress library of Biogas 2018 is now available online:
Link leider nicht mehr verfügbar.
Test our density module for up to two months – at no cost!
Density measurement of fuel offers the following options:
Direct mass calculation – Do you need to upgrade your existing volumetric system due to legislative requirements? Our density module allows you to perform inline real-time measurement.
Quality parameters – Are you experiencing quality issues in your application during transportation or storage? Density can be used as a direct indicator of quality. Detect any quality issue, such as fuel adulteration.
Density and viscosity of liquids and gases are determined on the basis of vibronic MEMS sensors.
Resonant vibrating microstructures form the basis for the measuring modules of TrueDyne Sensors AG in Reinach, Switzerland. Through interaction with the fluid, vibration properties such as resonant frequency and vibration quality of the structures change. Using physical models, the density and viscosity of gases and liquids can be determined from these parameters. The manifold application possibilities of the measuring instruments include engine test benches, burner control or gas quality monitoring. Join us on the path from vibration to measured value, in the following article
(Only available in german).
Patrick Reith, R&D Project Manager MEMS
TrueDyne Sensors AG


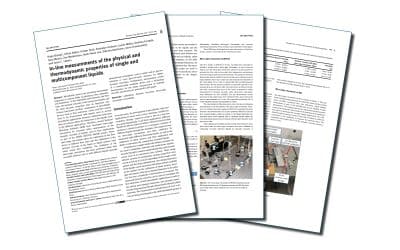


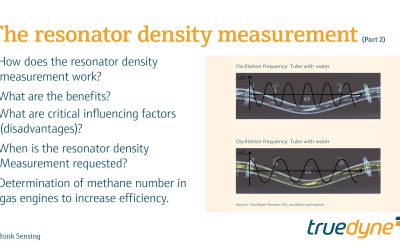


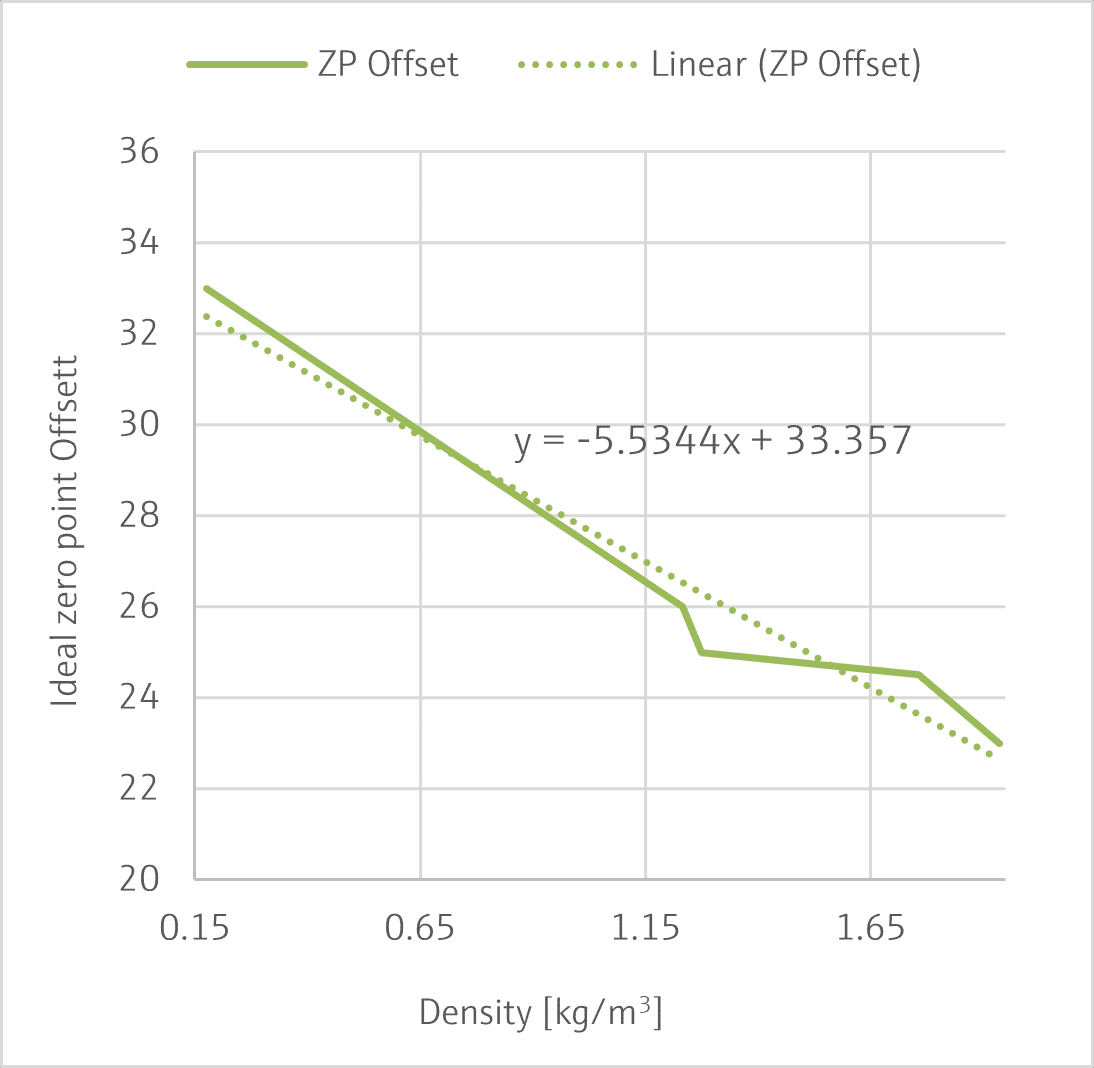
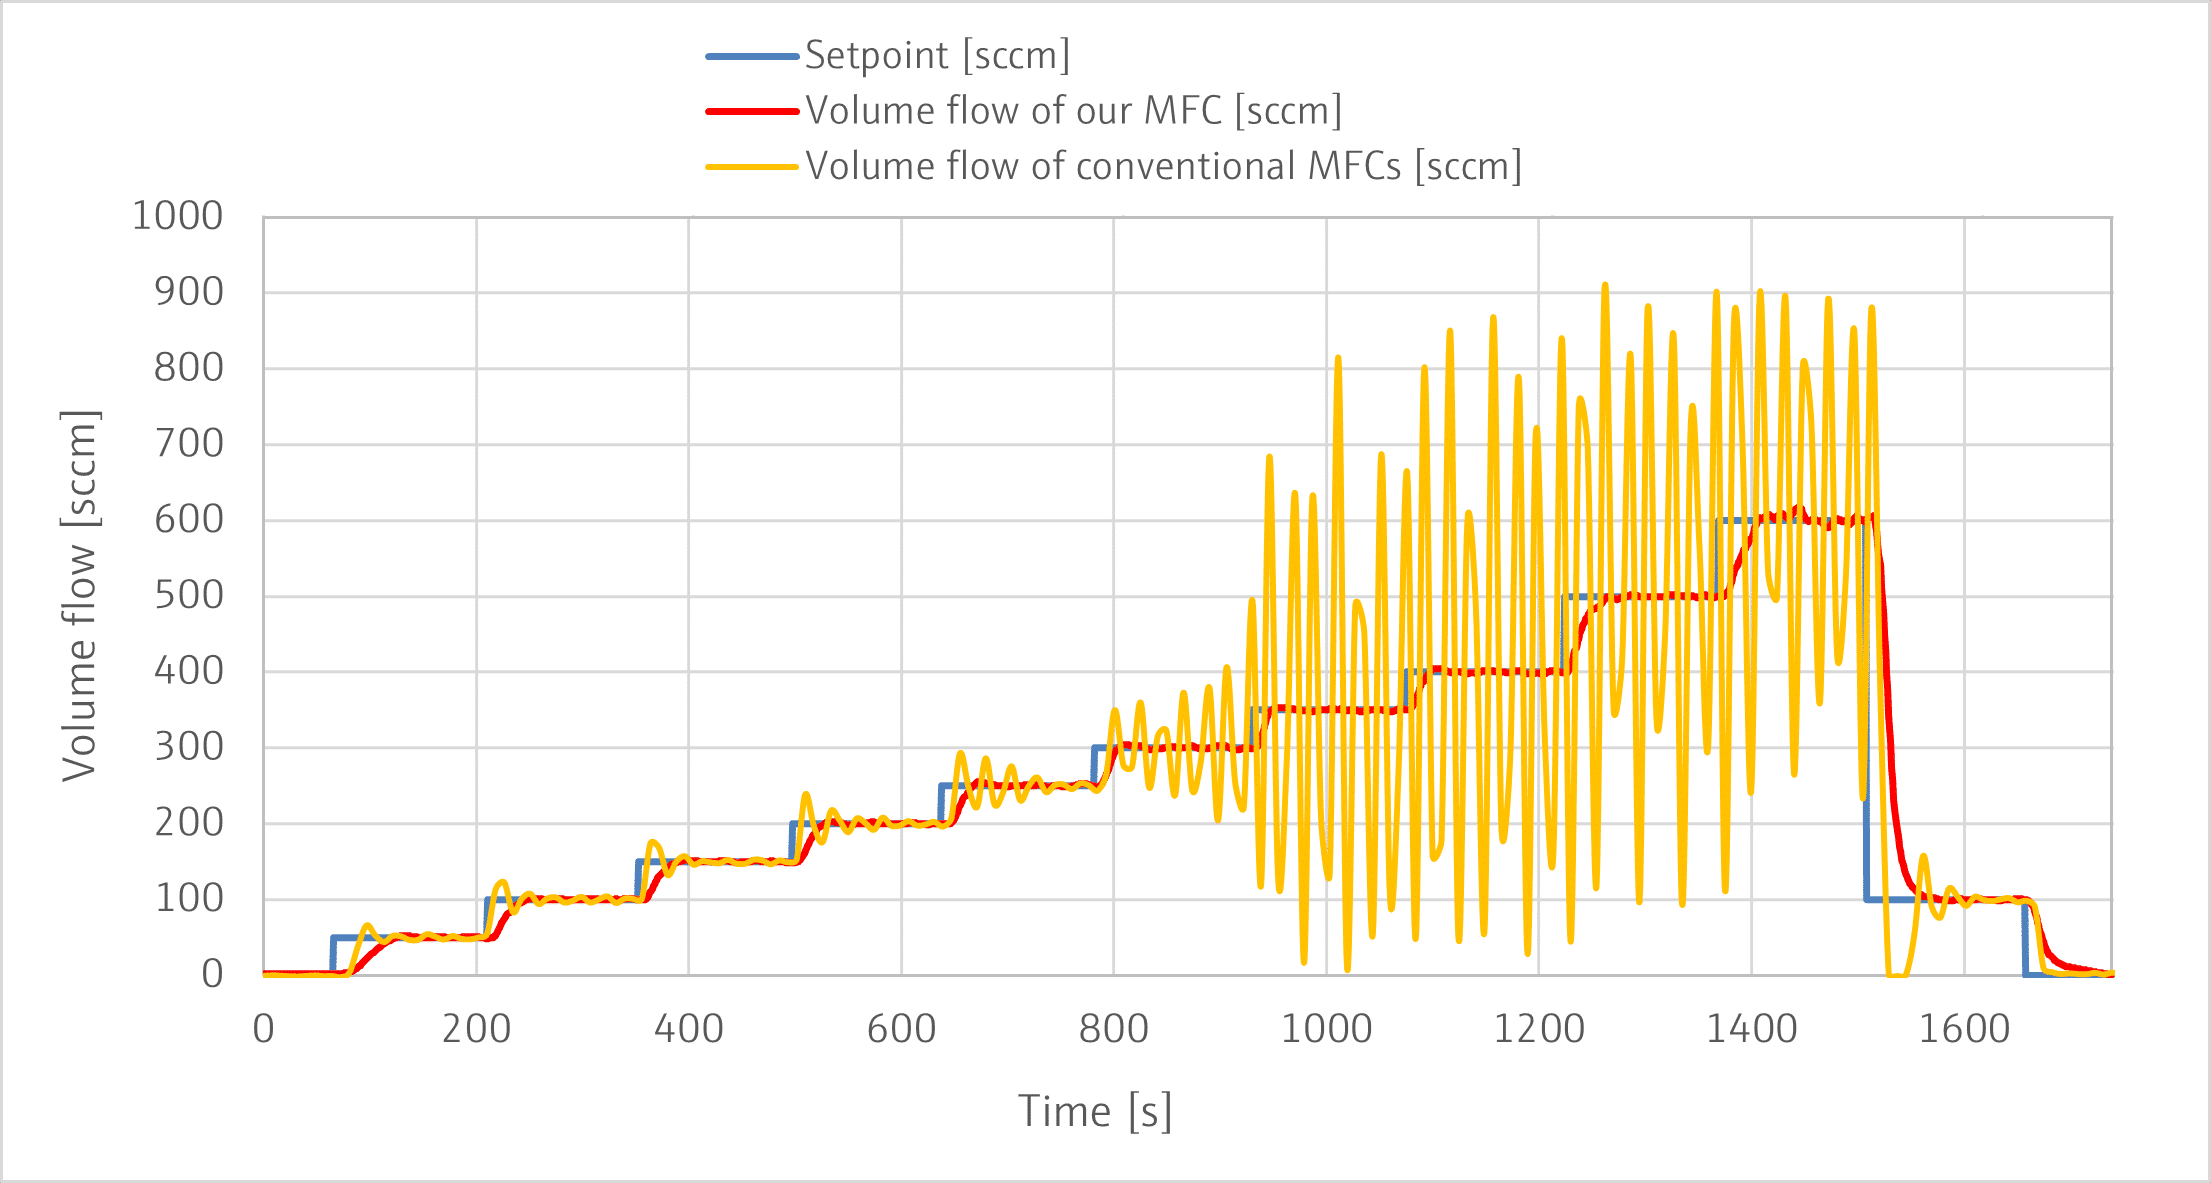


")